Categories
Bad Science Bait & Switch Big Picture British Biogas British Sea Power Conflict of Interest Delay and Deny Demoticratica Design Matters Direction of Travel Divide & Rule Emissions Impossible Energy Change Evil Opposition Fossilised Fuels Freak Science Green Investment Green Power Hide the Incline Hydrocarbon Hegemony Major Shift Marvellous Wonderful Mass Propaganda Media Non-Science Not In My Name Nuclear Nuisance Nuclear Shambles Obamawatch Peace not War Peak Energy Peak Oil Public Relations Realistic Models Renewable Gas Renewable Resource Scientific Fallacy Solar Sunrise Solution City Sustainable Deferment Technofix Technological Fallacy Technological Sideshow Technomess The Data Unqualified Opinion Wind of Fortune

Steve McIntyre : Plan Beak

[ UPDATE : SKEPTICALSCIENCE HAVE DEBUNKED STEVE McINTYRE. ]

Steve McIntyre, probably the only person on the planet who might grumble about the cost of Barack Obama’s suit rather than his all-American wars, has suddenly become an expert energy engineer, it seems.

This month, he’s taking aim at the Intergovernmental Panel on Climate Change, or IPCC, regarding their special report on Renewable Energy, questioning the contributions of an engineer, Sven Teske, and basing his objections on the fact that Teske works for Greenpeace :-

https://climateaudit.org/2011/06/14/ipcc-wg3-and-the-greenpeace-karaoke/
https://climateaudit.org/2011/06/16/responses-from-ipcc-srren/
https://climateaudit.org/2011/06/18/lynas-questions/
https://climateaudit.org/2011/06/20/the-carbon-brief-a-first-coat-of-whitewash/

Flinging any kind of pseudo-mud he can construe at the IPCC is not Steve’s newest of tricks, but it still seems to be effective, going by the dance of the close cohort of the very few remaining loyal climate change “sceptics” who get published in widely-read media :-

https://www.theregister.co.uk/2011/06/18/lynas_greenpeace_ipcc_money_go_round/
https://www.theregister.co.uk/2011/06/18/lynas_greenpeace_ipcc_money_go_round/page2.html
https://www.nationalpost.com/opinion/columnists/Lost+desmog/4968296/story.html
https://thegwpf.org/the-climate-record/3231-ipcc-used-greenpeace-campaigner-to-write-impartial-report-on-renewable-energy.html
https://blogs.telegraph.co.uk/news/jamesdelingpole/100092809/greenpeace-and-the-ipcc-time-surely-for-a-climate-masada/

He even pulled the turtleneck over Andrew Revkin’s eyes for a while :-
https://dotearth.blogs.nytimes.com/2011/06/15/a-deeper-look-at-an-energy-analysis-raises-big-questions/

And Mark Lynas has been joining in, in his own nit-picky way :-
https://www.marklynas.org/2011/06/new-ipcc-error-renewables-report-conclusion-was-dictated-by-greenpeace/
https://www.marklynas.org/2011/06/questions-the-ipcc-must-now-urgently-answer/
https://www.marklynas.org/2011/06/new-allegation-of-ipcc-renewables-report-bias/
https://www.marklynas.org/2011/06/the-ipcc-renewables-controversy-where-have-we-got-to/

The few comebacks have been bordering on the satirical, or briefly factual, with the exception of Carbon Brief’s very measured analysis of the IPCC’s communication expertise :-
https://www.carbonbrief.org/blog/2011/06/the-ipcc-and-the-srren-report
https://www.jeremyleggett.net/2011/06/mark-lynas-questions-hether-greenpeace-expert-should-be-an-ipcc-author/
https://thinkprogress.org/romm/2011/06/16/246665/ipcc-renewables-2/

Leo Hickman’s being bravely evenhanded :-
https://www.guardian.co.uk/environment/blog/2011/jun/21/peace-talks-climate-change-sceptics

It’s not a total surprise that New Scientist and The Economist wade in deep :-
https://www.newscientist.com/article/dn20583-conflict-of-interest-claimed-for-ipcc-energy-report.html
https://www.economist.com/blogs/babbage/2011/06/ipcc-and-greenpeace

Sven Teske’s explanation has not been accepted by Mark Lynas, although it seems really OK to me :-
https://www.greenpeace.org/international/en/news/Blogs/climate/the-ipccs-renewables-report-finds-a-clean-ene/blog/35322

The Daily Mail digs out the usual emotive terms :-
https://www.dailymail.co.uk/news/article-2004440/Leading-climate-change-group-used-Greenpeace-campaigner-write-impartial-report-renewable-energy.html?ito=feeds-newsxml

Steve McIntyre is playing out the “Princess and the Pea” narrative, complaining about a few wrunkles in a process of international collaboration, and distracting us from looking at the actual report, which I would encourage you most warmly to do :-

https://srren.ipcc-wg3.de/
https://srren.ipcc-wg3.de/report

It is full of the most incredible case studies and intriguing engineering discoveries. It makes cautious, conservative calculations, and looks at conditions and caveats in a very transparent manner. For a work that relied on the contributions of over 120 people and managed to compose a document so helpful and illuminating, I’d say it’s a work of profound achievement, and should be read in every school and university. Four scenarios from a collection of 164 are studied in depth to compare their strengths and weaknesses – and the conclusion of the SRREN team is that :-

https://srren.ipcc-wg3.de/press/content/potential-of-renewable-energy-outlined-report-by-the-intergovernmental-panel-on-climate-change

“Close to 80 percent of the world‘s energy supply could be met by renewables by mid-century if backed by the right enabling public policies…”

Somehow, though, Steve McIntyre believes otherwise. I suppose it’s not completely fair to berate him, because he might be suffering from a delusion, given that he seems to believe his opinion trumps that of over a hundred of the world’s authorities on what is possible in Renewable Energy technologies; and I’m the last person who would criticise somebody for having a mental illness.

I’m wondering, however, since he often sticks his nose up at IPCC matters, and since the world is suffering from stress in the supply of fossil fuels, whether he has a “Plan Beak” for the world’s energy crisis ?

Come on Steve McIntyre, tell us what your plan is to provide energy for humanity. Don’t tell me you believe that Nuclear Power is the way forward. I just won’t believe you, and a large number of the citizens of the UK, France, Germany, Japan, Italy and help us all, even Switzerland, would share my doubts.

As everybody can clearly see from the Columbia University graph at the top of this post, the IPCC are right about emissions, and the global warming data shows they’re right about that too. Why should they be wrong about Renewable Energy ?

I mean, I detect there are a few issues with the way the IPCC organises itself, and the style of its reports, but hey, where’s the viable alternative ? I don’t see one, anywhere. And don’t go pointing me to groups with pretensions.

We may just have to get used to complex international bodies, formed of complex, intelligent people, and learn how to read their complex, intricate reports with care and attention. And not get distracted by grumpy semi-retired mining consultants.

Categories
Bad Science Bait & Switch Climate Change Corporate Pressure Divide & Rule Energy Change Energy Insecurity Energy Revival Engineering Marvel Fossilised Fuels Freak Science Genetic Modification Genetic Muddyfixation Green Investment Hydrocarbon Hegemony Major Shift Mass Propaganda Media Non-Science Nuclear Nuisance Nuclear Shambles Oil Change Optimistic Generation Peak Emissions Peak Energy Policy Warfare Political Nightmare Protest & Survive Realistic Models Renewable Resource Science Rules Scientific Fallacy Technofix Technological Fallacy Technological Sideshow Technomess The Data The War on Error Unqualified Opinion

Mark Lynas : Mutant Ninja

Mark Lynas may call himself a “green”, and be a clean-shaven, respectable, politely-spoken Oxford academic type but he appears to be mutating into something very unappealing indeed. He’s written some good books on climate change – every schoolroom and university module should have one – but on energy, he is deep in the political woods, without even a wind-up flashlight.

His latest stunt is to join in with accusations from Steve McIntyre of Climate Audit that the IPCC’s report on Renewable Energy has been partly crafted by people without appropriate independence or expertise. Here, from Andrew Revkin :-

https://dotearth.blogs.nytimes.com/2011/06/15/a-deeper-look-at-an-energy-analysis-raises-big-questions/

“The IPCC must urgently review its policies for hiring lead authors – and I would have thought that not only should biased ‘grey literature’ be rejected, but campaigners from NGOs should not be allowed to join the lead author group and thereby review their own work.”

And who is this nefarious untalented Non-Governmental Organisation ? Greenpeace, it appears, according to Mark Lynas, is not capable of writing about the future of energy (or even the current situation).

Daniel Kammen has weighed in and The Revkin has updated his post :-

“There is no Himalaya-gate here at all. While there are some issues with individual chapters, there is no ‘Greenpeace Scenario.’ The 77% carbon free by 2050 is actually more conservative than some cases. The European Climate Foundation, for example has a 100% carbon neutral scenario and Price Waterhouse has a very low carbon one for North Africa. Further, while the IPCC works from published cases, the scenarios are evaluated and assessed by a team.”

There have been a number of reports written in the last year that back the viability of Renewable Energy technologies in replacing the world’s fossil fuel and nuclear energy systems. Not all of them were crafted by Greenpeace researchers. In fact, virtually none of them. Nuclear…yes…maybe it’s that little word “nuclear” that’s the root cause of Mark Lynas’ problem with Greenpeace.

In the Guardian, he is quoted as saying :-

https://www.guardian.co.uk/environment/blog/2011/jun/15/italy-nuclear-referendum
https://www.guardian.co.uk/environment/2011/jun/13/greenpeace-foe-charles-secrett-criticism

“Many ‘green’ campaigns, like those against nuclear power and GM crops, are not actually scientifically defensible…”

And that’s where you are so wrong, Mark Lynas with the book coming out soon that you seem so desperate to publicise by saying things you know people will find annoying. Nuclear power is a TECHNOLOGY, not a SCIENCE. This is the same basic category error made by Dick Taverne and a number of other public commentators who don’t appear to have an engineering background.

TECHNOLOGY is where people decide that their designs to make something look like they’ll work, build them and don’t foresee flaws with them. SCIENCE is where people study the technology that they’ve built and research the flaws that appear and report on them. Science is what has shown the limitations with the original boasts about genetically modified crops. It turns out that GMOs are a ruse to sell chemicals. And on nuclear fission – the science is in and on the front of your daily newspaper : nuclear power plants pose a number of risks. The advice of the reputable scientists and engineers – old fission nuclear power plants should be withdrawn.

But returning to Renewable Energy, a number of organisations now believe that the demise of fossil fuels needn’t stop humanity from accessing abundant energy. Here is just a very short compilation :-

The Two Marks : Mark A. Delucchi and Mark Z. Jacobson :-
https://www.peopleandplace.net/on_the_wire/2011/2/5/mark_jacobson_and_mark_delucchi_wind_water_and_solar

PriceWaterhouseCooper :-
https://www.pwc.co.uk/eng/publications/100_percent_renewable_electricity.html

CAT Zero Carbon Britain 2030 :-
https://www.zerocarbonbritain.com/

Roadmap 2050 :-
https://www.roadmap2050.eu/

European Renewable Energy Council R[e]volution :-
https://www.erec.org/media/publications/energy-revolution-2010.html

But oh, no, we can’t quote the last one because Greenpeace researchers were involved, and Mark Lynas wouldn’t approve of that. Mark Lynas appears to be living in a world where Greenpeace people can’t have engineering research skills because they have ideals, working for a world that uses safe, clean energy.

The IPCC report on Renewable Energy is here :-
https://srren.ipcc-wg3.de/

Much as I respect turtles, I have to say it – Mark Lynas, you’re a turtle – slow-moving and easy to catch out and turn into soup. You should know by now not to get sucked in by spurious non-arguments from Steve McIntyre. The “cleantech” industry that’s ramping up to provide the world with green energy is worth billions, soon to be trillions of dollars worldwide, and this fact appears to have completely passed you by. The only future for energy is sustainable, renewable, non-nuclear, clean, quiet and safe. There is no other viable, liveable, option.

[ UPDATE : In the Independent newspaper, Mark Lynas is quoted as remarking “Campaigners should not be employed as lead authors in IPCC reports”. So, Mark, it’s really fine for employees of the major oil, gas and mining companies to take a leading role on major IPCC reports; but it’s not fine, according to you, that somebody working for much less money and much higher principles than mere corporate profit should contribute ? Denigrating somebody for being a “campaigner” is a stereotypical insult. Everybody’s got an agenda, campaigners included. What’s your agenda, Mark ? Selling your new book ? Don’t be dismissive about Greenpeace researchers. They may have ideals, but they’re not naive – they also have brains – and with their declared position on getting at the truth they can be trusted to be direct, decent and honest. Where’s your ethical compass, Mark ? ]

Viva Italia !

Categories
Bad Science Science Rules Scientific Fallacy Technological Fallacy The Data The War on Error

Retour au Latour

In the realm of conspiracy theories, one branch is particularly difficult to unseat – suppositions of technological risks to health – or what I am naming “technocankery”, since a good number of them attribute cancer to the use of technology. Why, it is clear to see : cancer is caused by small, unseen mutations, and it’s hard to pinpoint causal effects. “Carcinogen” is therefore a useful accusation to hurl at any technology you don’t like, even if you have no proof or evidence.

But we’re doing science. How we know what we know is through a long chain of experimentation and monitoring, data gathering that can lead to reasonable claims that can then be subject to further testing and assessing. People rightly assert that we need to keep our minds open to possibilities unconceived, or mistakes unknowingly trodden. As the Dalai Lama Tweeted 25th May 2011 : “To arrive at certainty, you need to start from a skeptical posture. The best scientists are impartial, not swayed by their own beliefs.”

Categories
Be Prepared Climate Change Climate Chaos Climate Damages Delay and Deny Disturbing Trends Extreme Weather Freak Science Global Heating Global Singeing Global Warming Incalculable Disaster Near-Natural Disaster Neverending Disaster The Data The War on Error

No Connection

Many news articles now follow a predictable path. Some awe-inspiring, statistics-shaking weather event hits town – in the case of Joplin, literally. Then some people muse about whether these extreme events could have anything to do with Global Warming. Then some other people smother the idea very publicly. “No one weather event can be attributed to Climate Change !”, they insist, and yes, in the grand scheme of things they’re right – you cannot say for certain that one freak tornado, hurricane, flood or storm can be cast iron guaranteed to have been caused by atmospheric heating and increased sky water vapour. There is No Connection, official, and we can all breathe a sigh of relief and donate to a worthy clean-up cause.

Categories
Bad Science Emissions Impossible Science Rules Scientific Fallacy The Data

Netting It

Christopher Booker and James Delingpole made common cause this weekend in opposition to the BBC 2 Horizon documentary “Science under Attack” that featured Paul Nurse :-

https://blogs.telegraph.co.uk/news/jamesdelingpole/100074031/sir-paul-nurses-big-boo-boo/

https://www.telegraph.co.uk/comment/columnists/christopherbooker/8290469/How-BBC-warmists-abuse-the-science.html#dsq-content

The Daily Telegraph commentators appear not to understand the Global Carbon Cycle, and how this has been disturbed by mankind’s activities – principally burning fossil fuels and cutting down trees.

There is ongoing exchange between the soil and the air and the plants and the air, and the seas and the air, and so on; but the key Carbon Dioxide fact is that it is building up in the sky.

It’s not the gross figures that count, it’s the net.

The net is the amount that gets left in the air when all the absorption and emissions processes from the Carbon Sinks and the Carbon Sources have nearly cancelled each other out :-

In the Horizon programme the observation is made that mankind’s Carbon Dioxide emission production comes to around 7 gigatonnes a year. By contrast, volcanoes “popping off” and the oceans contribute only about 1 gigatonne – obviously, that’s net, not gross.

The amount of Carbon Dioxide exchanged in both directions between air and seas is much larger :-

Booker claims that the programme was a “misrepresentation”. Delingpole claims that Paul Nurse has demonstrated “really basic, idiot’s-level mistakes about “climate science””.

Amusingly for me, neither of them appear to suspect they could be barking up the wrong creek with the wrong paddle.

Categories
Global Warming Science Rules The Data

Revealing the Global Warming Signal

Revealing the Global Warming Signal
Jo Abbess
06 January 2011


1. The statistical meaninglessness of the global average temperature

Analysis of datasets of Earth surface temperatures from instrumental records and reconstructions from proxies should take into account vital metadata, measured knowledge about cyclic influences, annotations of overall climatic regimes and unique short-term events, that can enable informed analysis. “The climate system…has multiple components with physically distinct characteristics…basic physical considerations argue strongly against the notion that the global average surface temperature has a single characteristic time scale, or time constant.” (Foster et al., 2008). Discussion of uncontextualised curves can be counter-productive (BBC, 2010), as the appliance of inferential statistics and other numerical techniques has been contested as inappropriate (Kelly and Jones, 1996; Mann et al. 1998; Rahmstorf, 2006; von Storch et al., 2004, Wahl et al. 2006), given that variables forcing the thermal response of the climate cannot be assumed to behave in a Gaussian probabilistic fashion, be unmodulating over time, be independent of each other or be guaranteed to have linear effects. Much is now known about internal cyclic variability, and unrepeatable influences such as random volcanicity, the time parabola of industrial aerosol ejection, major fire seasons and the profiles of short-lived “climate shift” re-organisations (Miller et al., 1994), so it can be claimed that the climate system is no longer a black box, and should not be mathematically treated as such. A reasonable axiomatic assertion can be made that the rapid accumulation of greenhouse gases in the atmosphere is causing a regular time-varying response, but that this can only be revealed by systematically deducting the impact of other well-studied signals. As the climate system is composed of ongoing and random events, and suffers episodes of localised non-linearity, with suggestions of chaotic bifurcation thresholds and hints of multiple stable states, this is not facile. The development of a standardised “resolved” global temperature dataset with less noise would be a useful communication tool. Published and tracked over time, it could give a clear visual signal of whether the thermal response is departing from the projected pathway – a useful policy tool. The detection and attribution of global warming using datasets of real world observations that are filtered for known effects is a valuable exercise that corroborates modelling of the radiative forcing on the climate system. One representative study of this kind has resolved the underlying global warming trend as continuously and consistently rising. “Global-mean surface temperature is affected by both natural variability and anthropogenic forcing…identifying and removing from global-mean temperatures the signatures of natural climate variability over the period January 1900 [to] March 2009…filtered from the record, the residual time series reveals a nearly monotonic global warming pattern since [about] 1950.” (Thompson et al., 2009).

As part of a fully comprehensive method, in order to be confident that millenial-, age- or even epoch-scale changes are not influencing current temperature evolution, it is first necessary to consider our place in geological time by summarising the outcomes of paleoclimatological research. Then, it is necessary to consider all the lines of evidence that parametrise modern era climatic influences, developing indices (indexes) of their magnitude and duration, enabling their effects to be deducted from the total at all points, to reveal the underlying global warming signal. It is also necessary to isolate and remove errors in instrumentation, which may result from changes in instrument choice or method, or bias owing to the distribution of measurements, or other features of data collection. Only when the residual anomalies are revealed is it appropriate to discuss statistical analysis of the radiative forcing of global temperatures.


2. Our place in geological time

2.1 The 6 billion year time scale

This time period includes the accretion of the Earth. The carbon dioxide concentration in the Earth’s early atmosphere was very high, and this was only significantly reduced and replaced with atmospheric oxygen when life forms emerged that respired oxygen, and minerals became oxygen-saturated, starting some time after 2.5 billion years ago (Anbar et al., 2007; Bolin et al., 1979). Evidence suggesting the sequestration of carbon dioxide by the “biological pump” and weathering can be seen in the “descending stairway” glacial periods of the Vostok ice core record of the last 800,000 years (Jouzel et al., 2007). Aside from periodic interglacials, major volcanism and extinction events (Ward, 2006), the tendency has been towards less carbon dioxide in the atmosphere, and less greenhouse effect on global temperatures.

Current trend of surface temperatures on this timescale : gradual cooling.

2.2 The 500 million year timescale (Phanerozoic)

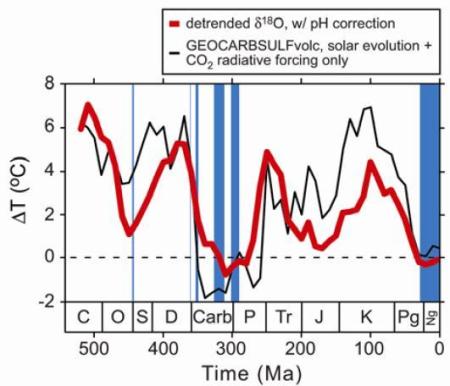
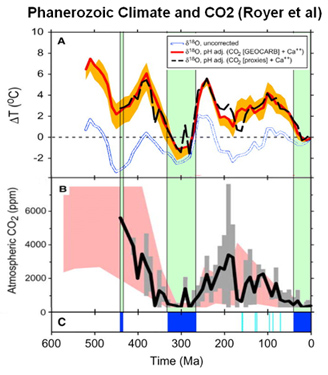
The GEOCARB III project and other research into deep time proxies from the emergence of multicellular life, show that over the last 500 million years the Earth has cycled between an “ice house” and a “greenhouse”, and that we are currently experiencing the low point of a Great Ice Age, with significant glaciation of the polar regions (Royer et al., 2004). Evidence from the previous cold state, the “Permo-Carboniferous”, which had a similar continental layout on the Earth’s surface as today, and could be analogous, shows continued glaciation for around 50 million years. The current Quaternary “ice house” has been running for less than 50 million years and so could be expected to continue.

Current trend of surface temperatures on this timescale : overall cooling since around 250 million years ago (Royer et al., 2004, Figure 4), and currently stable in the low temperature range.

2.3 The 65 million year timescale

The permanent glaciation of Antarctica occurred around 34 million years ago (DeConto and Pollard, 2003, Figure 2c). Commencement of episodic glaciation of the Northern Hemisphere is thought to have been possible since around 25 million years ago (DeConto et al., 2008), and extensive glaciation of the North Pole region occurred around 3 million years ago (Lunt et al., 2008). There is evidence of several major spikes and optima in temperature including the Palaeocene–Eocene Thermal Maximum (PETM) at 55 million years ago (Bloom, 2010; Zachos et al. 2008 Figure 2). These have been attributed to various external forcings such as large volcanic or mantle plume emissions of carbon dioxide and methane from the Earth’s interior, or changes in the deep ocean currents or sea level, causing the sudden release of methane from subsea hydrate provinces (Davy et al., 2010; Bice and Marotzke, 2002). Overall, however, the general trend has been a reduction in temperatures.

Current trend of surface temperatures on this timescale : generally falling.

2.4 The 5 million year timescale

This timescale features climate cycles that change in phase from shorter to longer over the period (Lisiecki and Raymo, 2005, Figure 4, LR04 oxygen 18 isotope proxy for average global ocean temperature). Whilst the most recent cycle peaks are roughly as warm as those at the start of the period, the cycle troughs are cooler. There was near monotonic cooling of the envelope over this timeframe, not perturbed by the onset of permanent Northern Hemisphere glaciation.

Current trend of surface temperatures in this timescale : cooling.

2.5 The 1 million year timescale

Ice cores range back to around 800,000 years, revealing the onset of 9 interglacials (Luthi et al., 2008, Figure 2). Each interglacial period shows relatively sharp warming over a period of several thousands of years, followed by a slow decline in temperatures over the next tens of thousands of years, until conditions cross a threshold and a glacial period begins. Each glacial period is punctuated by multiple relatively rapid and short-lived warmings (interstadials), which are thought to portray roughly 1,470 year cycles of Dansgaard-Oeschger events in Bond cycles, interspersed with Heinrich events (Alley, 2000b, Figure 12.4; Bond and Lotti, 1995; Bond et al., 1997; Bond et al., 2001; Debret et al., 2007; Fluckiger et al, 2006; McInnes, 2008).

The last glacial period began around 116,000 years ago, and terminated around 11,000 to 12,000 years ago, and had around 25 Dansgaard-Oeschger cycles in that period (NGRIP, 2004, Figure 4). The current interglacial, which began roughly 12,000 years ago appears to be more uniform than previous interglacial periods, and has shown a gradual decline in overall temperatures, as do previous interglacial periods.

Current trend of surface temperatures in this timescale : cooling.

2.6 The 20,000 year timescale

The Earth’s climate experienced its Last Glacial Maximum at around 20,000 years ago, with deglaciation tracking the solar forcing (Clark et al., 2009) into the cooler Older Dryas period (that included Heinrich Event H1) starting 18,000 years ago (Shakun and Carlson, 2010). Bolling-Allerod warming starting around 14,500 years ago (Liu et al., 2009), followed by the sharp Northern Hemisphere-focussed cooling of the Younger Dryas period at 12,900 years ago (Broecker, 2006; Murton et al., 2010), and a sharp warming again at around 11,700 years ago (Steffensen et al. 2008, Figure 2), the Termination 1 that heralded the Holocene era. This start to the current interglacial has been compared to Termination 5 which had a similar start-stop-start (“AMOC hysterisis” – Liu et al., 2009) behaviour (Marine Isotope Stage 11 (MIS 11)).

Since the start of the current interglacial period beginning at Termination 1, there have been several cooler periods (stadials), including what is termed the 8.2 kiloyear event (Carlson et al., 2009). The current interglacial period has been characterised by several periods of slightly warmer temperatures, at both millenial and centennial scales, but for the past 6,000 years, temperatures have generally been on the decline. The current interglacial period is expected to last for some time longer – 50,000 years (Berger and Loutre, 2002).

Current trend of surface temperatures in this timescale : cooling.

2.7 The last 8,000 years

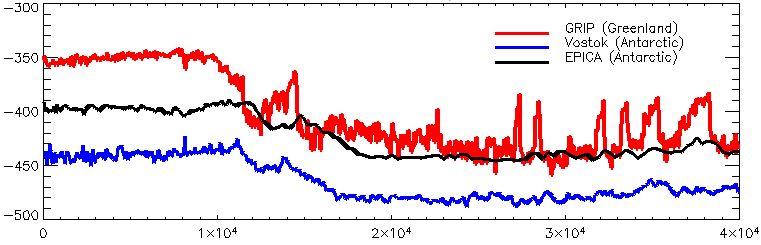
Within the 8,000 year timescale, there were several significant cooling and warming events identifiable in the Arctic region of the of Late Holocene, under an overall cooling arc, according to data available from the Greenland Ice Sheet Project (GISP 2) (Figure 1). Since approximately 3,500 years BP but prior to the 20th Century, there were four warmer than average centennial-scale periods, with successively lower peaks (Figure 2). Over the 8,000 year timeframe there were approximately 10 cooling-warming cycles, with most periodicities between 500 and 800 years (Kaufman, 2009; Turney, 2005, Figure 5 for one proxy). These are variously considered to be driven by solar cycles (Jiang et al., 2005; Ogurtsov, 2010) or oceanic seesawing (Barker et al., 2009; Maslin et al., 2001; Maslin and Smart, 2009; Seidov et al., 2001; Severinghaus, 2009; Stocker and Johnsen, 2003; Swingedouw et al., 2008). Northern Hemisphere temperatures as a whole do not show the same signature of the Greenland variations in reconstructions (Christiansen and Ljungqvist 2010; Jones and Mann, 2004; Ljungqvist, 2010; Mann et al., 2008, Seppa et al., 2009), and so the underlying causes of Greenland temperature cyclicity cannot be invoked to explain anomalous global warmth in the 20th and 21st Centuries.

Temperatures in Antarctica were more stable, reflecting its climatic isolation, and experienced an overall cooling arc from about 6,000 years BP, having recovered from the 8.2 kiloyear cooling event, which shows a correlate in the Northern Hemisphere record, and can therefore be taken as global in scope. The ice core from EPICA Community at Dronning Maud Land in Antarctica published in 2006 (EDML) shows this clearly (Figure 5), and the EPICA Dome C data also indicates a similar shift (Figure 4). Studies of solar forcing suggest that the cooling trend could continue for another 23,000 years (Imbrie and Imbrie, 1980).

Current trend of surface temperatures on this timescale : cooling.

2.8 The 150 year timeframe

This has been the period of the instrumental record, and has shown rapid warming consistently throughout, which appears to be unprecedented. Although there is evidence of abrupt climate change in recent millenia, these events appear to have been generally sub-decadal, probably associated with changes in oceanic circulation that seem to cross some threshold (Alley, 2003; Alley, 2007; Bond et al., 1999; Broecker, 1997; Broecker, 1999), concentrated (at commencement) or localised in a particular region (Grachev and Severinghaus, 2004; Kobashi et al., 2008; Murton et al. 2010), and if there was a warming, a cooling generally came first (Steffensen et al., 2008). The last 150 years do not resemble this scenario. There appears to have been a departure from cooling trends at around 1880 (indicators point to a range between 1850 to 1910) AD, and a decadal rate of warming that appears significant on a centennial timescale.

Ocean waters in the Arctic and North Atlantic have recently been freshening (Peterson et al., 2006), but it is uncertain if this threatens a collapse of the North Atlantic Meridional Overturning Circulation (AMOC) (Bryden et al., 2005; Garzoli et al., 2010 Section 5 “Fresh Water Balance”, Holmes et al., 2010, Page 2). It seems that the Atlantic circulation has changed its pattern since the advent of the Holocene era (Negre et al., 2010), so may not be subject to the same kind of abrupt climate changes as previously, although this doesn’t rule out rapid swings in future (Alley et al., 2003; Gregory et al., 2005; Lisiecki et al., 2008).

Temporally microfine “abrupt” salinity and temperature anomaly events in the Arctic relate to the natural internal variation of the Northern Atlantic Oscillation (Golubeva and Platov, 2009; Golubeva, 2010; Sundby and Drinkwater 2007), fresh water-induced, “cropped” quasi-Heinrich surges (Ziegler, 2009, pages 16, 98), which may be able to compensate for some of the land surface global warming anomaly by hemispheric oceanic thermal reorganisation (Thompson et al., 2010, Figure 1 “NH – SH”), “pumping” in phased steps driven by threshold conditions, but this periodic “negative feedback” has not interrupted the overall climb in global temperatures (Hansen et al., 2010).

Current trend of surface temperatures on this timescale : warming.


3. Current climatological influences

The current trend for surface temperatures is warming. The principal theory to explain this is additional Greenhouse Effect from mankind’s activities – the Theory of Anthropogenic Global Warming. The IPCC’s Fourth Assessment Report confirms that the core elements of this theory are robust (IPCC, 2007c, Section TS.6 “Robust findings”). Although the theory has been verified in many respects, there are also clear uncertainties, particularly in the area of the Earth’s transient and equilibrium climate change response. The key question is whether the Earth, in responding to the global warming signal, can re-adjust its climate, via a set of negative (dampening) feedbacks, leading to little or no overall temperature change.

3.1 The Burden of Proof

In order to provide evidence of a causative relationship between mankind’s disturbance of the Global Carbon Cycle and putative global warming, certain things have had to be established :-

3.1.1 That the near surface atmosphere and upper ocean temperatures on Earth have been rising.

3.1.2 That so-called Greenhouse Gases cause the Greenhouse Effect, and that increasing Greenhouse Gas concentrations in the atmosphere can cause added Greenhouse Effect.

3.1.3 That concentrations of Greenhouse Gases in the atmosphere are rising.

3.1.4 That mankind’s activities are responsible for increasing levels of Greenhouse Gases in the atmosphere (“fingerprinting” from detection and attribution studies).

3.1.5 That there are no tertiary factors that could be causing any similar magnitude of observed global warming.

3.1.6 That there are no cyclic internal variations in the Earth system that could account for any similar temporary or sustained magnitude of observed global warming.

3.1.7 That the data are accurate.

3.1.8 That climate change (in response to global warming) is not causing negative feedbacks to counteract global warming.

3.1.9 That changes in the Global Carbon Cycle (in response to global warming) do not counteract global warming.

3.2 The Evidence

3.2.1 Global Warming is happening

Robust findings from the IPCC Fourth Assessment Report Working Group 1 established a consensus on the evidence of global warming (IPCC, 2007c, Section TS6.2.1). More detailed understanding continues to be developed, such as the effect of stratospheric water vapour on tropospheric temperatures (Solomon et al., 2010), the irreversibility of warming because of ocean heat content (Solomon et al., 2009); confirmation of strong and continuing ocean heat content (Domingues et al., 2008; Ishii and Kimoto, 2009; Levitus et al., 2009; Lyman et al., 2010) and the string of warming records being broken in the major data sets (including NASA GISS (including “Warm Stations”), NOAA NCDC, Met Office HadCRUT3, RSS and UAH).

Measures have been taken to address the lack of temperature records and proxy temperature data in the Southern Hemisphere, such as the deployment of the ARGO network of ocean monitoring buoys. However the paucity of Southern Hemisphere data does not significantly alter the conclusion that this half of the Earth’s surface is also warming, in step although not in gradient, with the Northern Hemisphere (NASA GISS, 2010).

Differences between the major temperature records have been potentially ascribed to either the way that data is collectively treated and summarised (gridded) or differences in how temperatures are interpolated in the Arctic region from sparse monitoring. Despite this ongoing discussion, it is clear that all the major sources of data show synchronous regional and overall global warming of similar magnitude.

3.2.2 Greenhouse Gases cause the Greenhouse Effect

That Greenhouse Gases can absorb sunlight and re-radiate infrared (the “warming” part of the electromagnetic spectrum) is science that is roughly 150 old (Arrhenius, 1896). It’s basic Physics. Barring some entirely new postulated quantum effect from a particular species of gas or particulate matter found to form part of the atmosphere, or some previously undiscovered property of the Oceans or the solid matter that forms the Earth’s crust, it can be safely asserted that molecular gases with asymmetrical oscillatory modes are the cause of the Greenhouse Effect, keeping the Earth’s surface warmer by around 30 degrees Celsius (IPCC, 2007e, p. 97) than it would be without an atmosphere; as they have a warming effect on their surroundings in the presence of sunlight, through their behaviour in relation to electromagnetic radiation.

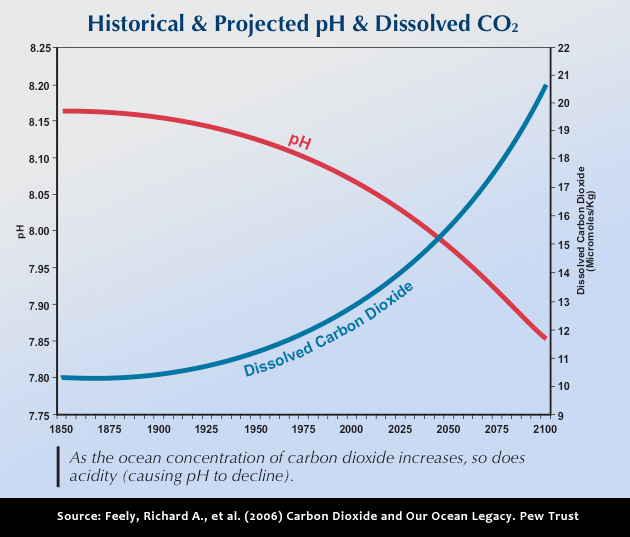
3.2.3 Greenhouse Gas Concentrations rising in the atmosphere

The data work on atmospheric species (NOAA, 2010) confirms unambiguously that concentrations of carbon dioxide and other Greenhouse Gases are rising in the Earth’s atmosphere. Methane concentration growth slowed (IPCC, 2007a, p. 7 (135) ), but since 2007 growth in its atmospheric concentration has restarted (Rigby et al., 2008). The oxidation of methane (Boucher et al. 2009) has likely led to an increase in stratospheric water vapour (IPCC, 2007a, p. 24 (152); Myhre et al., 2007). Ozone levels in the troposphere respond to methane concentrations (Fiore et al., 2008), and have also been rising (IPCC, 2007a, p. 3 (131) ). Modifications to the Montreal Protocol contributed to restraining growth in halocarbons, chemistry with high Global Warming Potential.

3.2.4 Fingerprinting Humankind

In detection and attribution studies, progress has been made in clearly “fingerprinting” humankind’s activities as the cause of rising concentrations of atmospheric Greenhouse Gases. The work on the ratios of carbon isotope species has shown that fossil fuel-derived carbon is increasing in the atmosphere. When fossil fuels are burned, they oxidate, and a clear signal of oxygen depletion in the atmosphere has been detected (IPCC, 2007a, Figure 2.3), which outstrips possible effects from deforestation, or the any mass death of photosynthetic life on land, or in the oceans, due to acidification from increased atmospheric carbon dioxide.

3.2.5 Significant External Forcings

In any empirical research that seeks establish the cause or causes of an effect, it is always necessary to consider tertiary factors to the hypothesis – other possible causes that may better explain the outcome. Also, it is necessary to consider indirect causation – that there is a precursor, a factor that causes the cause being considered.

Some influences on temperature in the Earth system are considered to be “external” to the normal climate cycles, and some as inherent “internal” variation (see further down).

3.2.5.1 Radiative Forcing

As a measure of the warming effect at the Earth’s surface, radiative forcing is more “readily calculable” (IPCC, 2007a, p. 5 (133) ) than overall climate sensitivity. The “forces for warming” arise from the composition of the atmosphere, influences from the chemical species, chemical reactions and airborne particulate matter (aerosols) such as dust and ash (Lohmann et al. 2010). There is discussion about whether some effects should be considered feedbacks or primary forcings (IPCC, 2007a, p. 153). There are also complex discussions about the sign of the influence, whether warming or cooling, at different heights in the atmosphere and various regional locations (Alterskaer et al., 2010). One of thorniest issues appears to be whether the forcings should be calculated in a way that discounts (Alterskjaer, 2010) or accounts (Hansen et al., 2005) for the short-term stratospheric response.

There is much agreement that the rapid increase in carbon dioxide in the atmosphere acts as a pulse, an almost instantaneous (in geological timescales) compositional change in the atmosphere and is modelled as such (IPCC, 2007d). There are still some areas of “low” scientific understanding (IPCC, 2007a, Executive Summary), but aside from studies on clouds, these are for chemistry where influence on warming is anticipated to be minor.

One key area of study is the various effects of industrial aerosols, particulate matter and chemical species produced by humankind’s activities such as burning fossil fuels for transport, electricity generation and manufacturing; which go on to reside and react at various regions and levels of the atmosphere (Hansen et al., 2005, p. 35), with various warming or cooling impacts. An example is the direct aerosol effect, the scattering and absorption of incoming solar electromagnetic radiation by airborne particulate matter. Scattering leads to less sunlight reaching the surface of the Earth, and is the key factor in what has been named “Global Dimming”, an effect that has protected the Earth from some global warming (Ramanathan and Feng, 2009). Dust has apparently been identified as a coolant (Mahowald et al., 2010), or has a mixed effect (Kok, 2010). The differences in the temperature records of the Northern and Southern Hemisphere can be partly explained by such studies.

High levels of aerosol in both the stratosphere and the troposphere are the major factors in the net negative radiative forcing at the surface of the Earth (IPCC, 2007a, p. 132, Executive Summary, p. 208, Section 2.9.5), however, the evidence is that Earth is as a whole still warming (IPCC, 2007b, Sections 3.2, 3.8), perhaps exponentially (IPCC, 2007b, Tables 3.2 and 3.3), which must be attributable to the tropospheric radiative forcings summing to a positive, warming value (IPCC, 2007a, p. 205, Section 2.9.2).

If the atmosphere, and the oceans, with which it interacts, were not in constant motion, and if the climate response didn’t include some additional warming (cooling) as positive (negative) feedback, the radiative forcing calculations could lead to straight-forward projections of global warming, but the real world is more complicated than just considering a simple well-mixed atmosphere in stasis on a non-rotating Earth. However, radiative forcing of atmospheric components, expressed in Watts per square metre, helps tease out the relative strength of various unknowns, such as the correct magnitude and sign of the warming influence of solar irradiance change in various parts of the electromagnetic radiation spectrum (Hansen et al., 2005 paragraph 8; Haigh et al., 2010).

3.2.5.2 Volcanic Eruptions

The Mount Pinatubo volcanic eruption in June 1991 afforded a prime opportunity to study the effects of volcanic aerosols in the atmosphere. The analysis showed an intense, but short-lived (less than 5 years), global cooling effect (IPCC, 2007a, pp. 132, 137, 142, 193). Regular volcanic activity does emit carbon dioxide (and methane too by disruption of sequestrated fossilised organic matter) into the atmosphere from the Earth’s crust (Hards, 2005), but measurements of carbon dioxide levels after eruptions do not show any great rise in atmospheric concentrations (NOAA, 2010). So, recent global warming cannot be attributed to volcanism.

3.2.5.3 Solar Irradiance Change

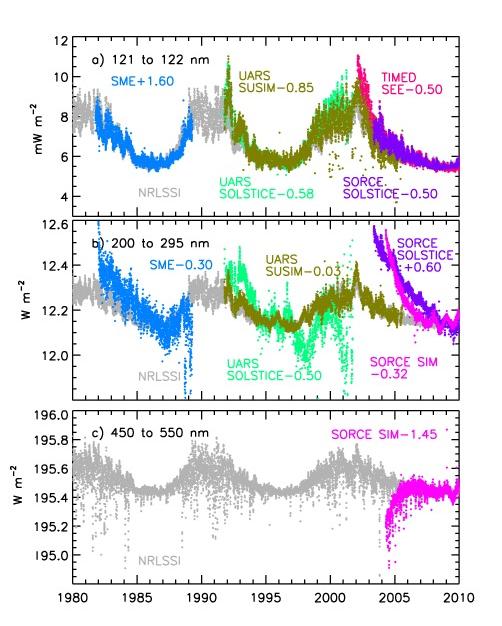
Obviously, the Sun is the primary cause of keeping the Earth’s surface warm, but the rate of recent rise in Earth’s surface temperature does not correlate significantly with changes in solar irradiance output (Lockwood and Frohlich, 2008). Changes in solar activity are considered to account for a small proportion of measured global warming over the last 100 years, but their contribution to global warming of the past 20 – 50 years is vanishing (Ammann et al., 2007; Duffy et al., 2009; Meehl et al., 2004, Lean, 2010; Lockwood, 2010). Solar side-effects such as the solar wind, and its effects on cosmic rays, and their purported effects on the atmosphere and its clouds have not been shown to have any significant effect (Skeptical Science, 2010). There is strong evidence from paleoclimatology that change in solar insolation due to the precession and tilt of the Earth’s axis, and its orbital progression around the Sun have strongly influenced climate cycles in the deep past (see Section 2). But then, as now, change in solar output and insolation have been cyclic or periodic, with quasi-sinusoidal change, whereas current global warming appears to be exponential and unidirectional. Episodic alterations in the spectral distribution of solar output during its short-term 11-year cycles may play a part in variations of the temperature of the near-surface Earth (Haigh et al., 2010), but again, these would be expected to crest and dip on the whole, whereas current global warming appears to be a sustained positive phase change.

3.2.5.4 Land Use Change

Deforestation is said to account for something in the region of 15% of net anthropogenic Greenhouse Gas emissions to air (van der Werf et al., 2009), and so, although it will have long-term, possibly permanent, effects on Earth’s climate, it cannot account for the bulk of recent warming. Nitrous Oxide is a Greenhouse Gas whose rising emissions are attributable to changes in agriculture (IPCC, 2007a), but it has only roughly a third of the effect of methane (IPCC, 2007a, Fig 2.21). Soil erosion and desiccation from agricultural intensification has led to a breakdown in the carbon cycle – less carbon dioxide is sequestered in soils, but the scale of emissions increase cannot account for the levels of warming being measured.

Widescale deforestation and the development of agriculture have been suggested to explain the extremely unusual and stable nature of the Holocene era (Ruddiman et al., 2010), in that the temperatures have not reduced rapidly after the warming spike at the end of the Last Glacial Maximum as they did in previous glacial Terminations, as seen in the ice core records (see Section 2). Global warming has reversed the general cooling trend of the last 6,000 years in the last 150 years or so, which just happens to coincide with vast increases in agricultural production and the exploitation of timber, aided by the use of fossil fuels for energy; but the fossil fuel emissions are by far the largest factor.

3.2.5.5 Rapid warming – alternative mechanisms

There have been several alternative mechanisms proposed for periods of rapid global warming in Earth history, one of which being the mass emission of carbon dioxide and methane during the collision of tectonic plates, triggering ocean anoxia and emissions of warming hydrogen sulphide and mass extinction (Ward, 2006). While there is evidence of anoxic events taking place currently, these seem to be associated with run-off from agricultural and toxic waste into the oceans. There is no evidence of the “ocean conveyor belt” (Lozier, 2010) undergoing major alterations which could allow explanations of large quantities of heat or methane being released to the atmosphere from ocean depths. Although there is evidence of rising methane concentrations in the atmosphere, and methane emissions are causing concern in the melting permafrost and tundra of the Arctic region, these are considered to be an effect of global warming rather than a cause, unlike ancient events (see Section 2).

The current warming can be attributed with high levels of confidence to radiative forcing. Confirmation comes from a wide variety of sources, for example, consideration of the Diurnal Temperature Range, stratospheric cooling, hemispheric and zonal differences in warming, and analysis of extremes and frequencies of extremes in weather.

3.2.6 Significant Internal Variability

The magnitude of the swings in internal variability in the climate can sometimes overwhelm the signal from global warming. However, variability cannot be equated with a trend. The aim of studies into variation must be to establish whether the changes are a result of global warming, or a cause. Here, the most significant internal variability factors are considered.

3.2.6.1 Oscillations – Climate Cycles

The air pressure oscillations and their climatic teleconnections are a significant feature of the Earth system, and it is important to be clear that recent global warming is not merely an upswing in one or more of these climate cycles. There is evidence of multi-decadal waves patterns, but oscillations would need to have a centennial-scale long cycle, or longer, to explain the current warming period.

When analysing climate oscillations it is important not to be misled by anomalies in the data series, which may be due to unrelated factors, or even instrument errors (see “Data Correction” section below). For example, the cooling phase between the late 1960s and early 1970s has been associated with a “Great Salinity Anomaly” in the North Atlantic – which could have been caused by meltdown in the polar region (Peterson et al., 2006, Figure 4; Thompson et al., 2010). Ongoing changes in Arctic precipitation and ice pack could be responsible for future short-term cooling episodes (Dickson et al., 2000, Figure 7; Miller et al., 2010, p. 21 (1699); NSIDC, 2008; Seo et al., 2010).

There is evidence of change in the climate oscillations as measured by their indices over timescales of decades – the patterns of the anomalies have changed as well as the trends (Hurrell et al, 2003, NCAR, 2010; NOAA Data, 2010). This suggests the climate oscillations are being altered by global warming.

There is an inherent problem in trying to assess the indices of the oscillations, as the “base” period on which the calculations of anomalies in the wave patterns are made may not represent a time of stability, as is suggested by the indices datasets themselves (Hurrell and Deser, 2009; NCAR, 2010). The mean of a moving target may not represent a suitable measure from which to judge movement overall.

The underlying trends for oscillations seen in the 1980s to 1990s have not persisted (Osborn, 2010), so some multi-decadal cyclicity could be a component of what is happening, or other factors may be coming into play, such as one-way-only threshold-reliant readjustment of the vertical layers of the atmosphere, or the transport between ocean basins. The evolution of the ENSO could corroborate this (Ashok et al., 2007).

Transformation arithmetic is used to calculate the “normal” patterns of oscillation in the climate of the ocean basins (Empirical Orthogonal Functions (EOF) or Principal Components Analysis (PCA)), and the reported indices are therefore modulation anomalies from these “carrier” wave patterns. However, if the basic modality of the oscillations are themselves subject to change, the approach breaks down at the first assumption (Kellie-Smith, 2010, 4.5 “Conclusion”). New ways to subtract the ENSO signal from global temperatures are being developed (Chen et al., 2008a, p. 5 “contaminates”, Chen et al. 2008b).

At present there is no contender for an oscillation that correlates either its positive or negative phase index, or both, with the global warming trend. A case in point is the Arctic Oscillation (AO), which showed a positive trend in its index throughout several decades, and suggested a correlation with global warming, but has now gone into a severe negative phase, even as 2010 is expected to be the warmest year in the instrumental record.

Combining the indices of the oscillations does not show a general trend, as they are all, to some extent, co-varying with time lags, which would tend to cancel them out. However, the ENSO oscillation, and polar modes including the North Atlantic Oscillation (NAO) seem to lead or greatly influence the others, and could be considered real internal variation.

3.2.6.2 Circulations

There has been some evidence that the ocean circulation patterns are changing in response to global warming (Sherwood et al., 2011; Williams and Grottoli, 2010). However, although highly variable, the strength of the Atlantic Meridional Overturning Circulation (AMOC) does not appear to be suffering significant reduction (RAPID-WATCH, 2010).

As regards air mass circulation, coincident with unusually low indices in the Arctic Oscillation (AO) in recent years, displacement of the jet streams have been implicated in “blocking” events, preventing the usual waves of propagation of anti-cyclones in the Northern Hemisphere (see “Mixed Layers” section below; WMO, 2010). Impacts cited in the popular press included the severe winter of 2009/2010, the extreme heat in Russia in summer 2010 and catastrophic flooding in Pakistan in the same season (Woollings et al., 2010). The IPCC Fourth Assessment states that blocking is trending in step with global warming, but only in the North Pacific in connection with La Nina (IPCC, 2007b, Section 3.5.4 “Blocking”). Recent events suggest it could become more general.

3.2.6.3 Mixed Layers

There is evidence that the tropopause has changed its height (Santer et al., 2003; Schmidt et al., 2008), most likely as a result of global warming, and clearly has implications for planetary waves at the troposphere-stratosphere boundary, jet streams and the annular modes of oscillation at the poles (IPCC, 2007b, Section 3.5.6).

The mixed layer between the atmosphere and the ocean has been showing the effects of ocean warming (Domingues, 2008), and the intensity of tropical hurricanes and other storms near the Equator has been shown to have increased owing to higher sea surface temperatures (Elsner et al. 2008).

These changes all have implications for the near-Earth surface temperatures, but it is determined that they are feedbacks, not causes.

3.2.7 Data Correction

Problems with global temperature data sets relate to a number of issues, including changes in technology, instrument bias and alteration in human systems of data collection. Anyone attempting to perform statistical modelling of climate systems based on the data sets will need to first iron out the data wrinkles, or else their analysis risks being unsound. One example is that of an apparent abrupt dip in sea surface temperatures in the period between 1940 and 1950, which it turns out can be explained as a data problem (Thompson et al., 2008). By using a simple arithmetic technique of subtracting oscillation anomalies (indices) and other well-known factors from the overall temperature records, it has been shown that the effect can be attributed to more measurements being done with one method than another. Another example of data correction is when Dr John Christy and Dr Roy Spencer famously had to retract claims regarding global warming when it was discovered that there were bias errors in satellite monitoring data, when in fact there are no significant difference between the major data sets when adjusted (Thorne et al., 2010).

3.2.8 Climate Feedbacks

There is ongoing research into cooling (negative) feedbacks in the climate system, and whether they could constrain the warming effect of increased concentrations of atmospheric greenhouse gases. If these effects are temporary, they could only offer a short-term reprieve. There has been much discussion around the “fertilisation effect” of increased atmospheric carbon dioxide, and evidence has been found to support that (Lewis et al., 2009), although this could be overwhelmed by future climate changes, including in rainfall patterns and drought (Dai, 2010).

There is some suggestion that global warming, since it leads to a higher level of water vapour sustainable in the atmosphere, could lead to enhanced cloud cover of forms that show increased cooling albedo – as long as this compensates for their added Greenhouse Effect. There remain considerable uncertainties about the role of clouds under current conditions of sharp global warming (IPCC, 2007c, Section TS6.2.1; IPCC, 2007b, Section 3 3.4).

Most feedbacks are found to be positive (warming), enhancing and amplifying global warming. The sensitivity of the climate – the exact level of the full-term warming response to the changes in atmospheric composition – remains uncertain, but is known to be significant (IPCC, 2007d).

3.2.9 Carbon Cycle Feedbacks and consideration of Paleo-Analogies

Given that Anthropogenic Global Warming, as proposed, would disturb the Global Carbon Cycle, possible responses have been assessed to see if they could counteract the warming by increasing the carbon pump or carbon sink effect.

3.2.9.1 Evidence of current Global Carbon Cycle change

There are uncertainties in how the Carbon Cycle will respond (IPCC, 2007f, Section 7.3; IPCC, 2007d, Section 10.4). There are some indications that the “biological pump” of the ocean that draws carbon dioxide down from the atmosphere may be compromised (Boyce et al., 2010). However, it is also possible that for now, the oceans and land plants (although not the soils, perhaps) are taking up the same fraction of carbon dioxide from the atmosphere as ever, meaning more carbon dioxide poached from the air in total (Knorr, 2009; Sarmiento and Gruber, 2002, Figure 3). These changes are best explained as being caused by global warming. Changes in the slow geological sequestration components of the Carbon Cycle are probably not measurable.

3.2.9.2 Paleo-Analogies

It is instructive to look back into the deep past to try to establish how the Global Carbon Cycle initially adjusted to, and then re-adjusted atmospheric carbon dioxide levels. These include the sharp warming occurred at the boundary of the Paleocene and Eocene geological eras (PETM) (Kopp et al., 2007), the mid-Eocene (Bijl et al., 2010), Termination V, MIS 11 (Bowen, 2010) and the mid-Pliocene (Ravelo et al., 2009). None of the periods so far considered can be a perfect analogy, because unfolding conditions are highly anomalous, including a very high rate of atmospheric carbon dioxide accumulation.

4. Conclusions

Recent global warming is a real effect (Thorne et al., 2010), and the only significant correlating relationship is with anthropogenic alteration of the atmosphere, as none of the alternative hypotheses could provide the magnitude or signature of the changes observed. The net emissions to air of greenhouse gases from anthropogenic sources, the side-effects of which include the ejection of aerosols, are altering the net radiative forcing. Having established confidently this is the reason for sustained and increasing global warming, it becomes justifiable to deduct the effects of internal variability and episodic external forcings such as volcanic eruptions from the temperature record in order to reveal the global warming trend. Correcting for data problems, compensating for volcanic episodes and deducting the indices of the major climate oscillations from the temperature record, the largest instantaneous modulations, vastly improves perception of the underlying warming signal (Thompson et al., 2009, Figure 12).

Further work on quantifying the change in climate oscillations could lead to new indices that could be applied to further smooth out the saw tooth nature of the progression of the temperature sensitivity of the climate. It remains for the climate change research community to collectively agree how the “resolved” datasets should be produced and published, showing the “smoother” baseline global warming pulse for public and policy use.

Figures

Figure 1
GISP2 Greenland Ice Sheet Project 2 Ice Core Data (Alley, 2000a; Alley, 2004; Cuffey and Clow, 1997).

Raw data points with a second order polynomial trend line added by Excel, covering data from approximately 12,000 years before present up until approximately 200 years before present to prevent the inclusion of the anomalously warm recent period. The second order polynomial trend line has been added automatically, merely to indicate the most likely point of temperature maximum but does not represent any precision in calculation.

Figure 2
GISP2 Greenland Ice Sheet Project 2 Ice Core Data (Alley, 2000a; Alley, 2004; Cuffey and Clow, 1997).

Raw data points with a second order polynomial trend line added by Excel, covering data from approximately 10,500 years before present up until approximately 200 years before present to prevent the inclusion of the anomalously warm recent period. The second order polynomial trend line has been added automatically, merely to indicate the most likely point of temperature maximum but does not represent any precision in calculation.

Figure 3
Lake Vostok Ice Core Data (Jouzel et al., 1987; Jouzel et al., 1993; Jouzel et al., 1996; Petit et al., 1999).

Raw data points with a second order polynomial trend line added by Excel, covering data from approximately 13,500 years before present up until approximately 200 years before present to prevent the inclusion of the anomalously warm recent period. The second order polynomial trend line has been added automatically, merely to indicate the most likely point of temperature maximum but does not represent any precision in calculation.

Figure 4
EPICA Community Dome C Ice Core Data (Jouzel et al., 2007).

Raw data points with a second order polynomial trend line added by Excel, covering data from approximately 13,000 years before present up until approximately 200 years before present to prevent the inclusion of the anomalously warm recent period. The second order polynomial trend line has been added automatically, merely to indicate the most likely point of temperature maximum but does not represent any precision in calculation.

Figure 5
EPICA Community Dronning Maud Land Ice Core Data (EPICA Community, 2006).

Raw data points with a second order polynomial trend line added by Excel, covering data from approximately 12,500 years before present up until approximately 200 years before present to prevent the inclusion of the anomalously warm recent period. The second order polynomial trend line has been added automatically, merely to indicate the most likely point of temperature maximum but does not represent any precision in calculation.

Abbreviations
ya = years ago, relative to 1950
BP = Before Present, relative to 1950
IPCC = Intergovernmental Panel on Climate Change
AR4 = IPCC Fourth Assessment Report
WG1 = IPCC Working Group 1

Glossary
LLGHG = Long-Lived Greenhouse Gas
ENSO = El Nino Southern Oscillation

References

Categories
Climate Change Climate Chaos Extreme Weather Floodstorm Incalculable Disaster Landslide Mudslide Rainstorm The Data

It’s just La Nina #1

Categories
Acid Ocean Climate Change Climate Chaos Global Warming Incalculable Disaster Major Shift Science Rules The Data Tree Family

This is how it is #4

Very long-lived trees tell the story of the last 5,000 years or so.

The gradual cooling of the Holocene interglacial is overtaken by a truly anomalous warming over the last few hundred years.

How unusual have conditions been in the last few hundred years ? The carbon 13 isotope can give us one point of view [ Boehm et al. (2002) ] :-

And the oxygen 18 isotope can add detail about climatic changes not readily apparent from the carbon isotope record [ Berkelhammer and Stott (2008) ] :-

The balance of oxygen isotopes in plants in this study provide some perspective on rainfall and storm patterns, which appear to have started changing before significant temperature changes came into view.

Depletion of oxygen from the atmosphere provides evidence that the accumulation of carbon dioxide is from the oxidation (burning) of fossil fuels :-

Shaffer et al. (2009)

But we’re going to have a carbon crisis in the oceans from a combination of acidification and thermal stress, long before we have an oceanic oxygen crisis :-

NOAA Weekly Coral Watch Forecast

Categories
Bait & Switch Climate Change Delay and Deny Divide & Rule Fair Balance Global Warming Hide the Incline Media Science Rules Social Chaos The Data

Met Office Reports : Media Opinion Differs

Image Credit : Hobos 4 Life

Oo, it’s so hard knowing which version of reality to plump for, if you have to judge by the headlines alone.

These articles were published on the same day, based on the same report from the Meteorological Office, in different high quality newspapers :-

https://www.guardian.co.uk/environment/2010/nov/26/global-warming-met-office

“World is warming quicker than thought in past decade, says Met Office : Report comes as scientists predict 2010 could be hottest year on record : Damian Carrington, The Guardian, Friday 26 November 2010 : The world warmed more rapidly than previously thought over the past decade, according to a Met Office report published today, which finds the evidence for man-made climate change has grown even stronger over the last year…”

https://www.telegraph.co.uk/earth/environment/climatechange/8159991/Global-warming-has-slowed-because-of-pollution.html

“Global warming has slowed because of pollution : Global warming has slowed in the last decade, according to the Met Office, as the world pumps out so much pollution it is reflecting the sun’s rays and causing a cooling effect. By Louise Gray, Environment Correspondent, 26 Nov 2010 : The latest figures from more than 20 scientific institutions around the world show that global temperatures are higher than ever. However the gradual rise in temperatures over the last 30 years is slowing slightly. Global warming since the 1970s has been 0.16C (0.3F) but the rise in the last decade was just 0.05C (0.09F), according to the Met Office. Sceptics claim this as evidence man made global warming is a myth…”

I think I’ll go with Damian Carrington’s version, because at least he mentions more than one possible reason for why Global Warming hasn’t been accelerating as much in the last decade as the ones immediately prior.

Despite the slow down in acceleration, the temperatures are still rising, so there’s no need to use the word “cooling” in Louise Gray’s sub-heading.

And there’s no reason at all for Louise to mention the anti-science so-called “sceptics”, who are actually deniers. They would deny the Moon was made of rock, if they could manipulate the tiniest piece of evidence, or twist the most innocent of words, to make it appear that there were uncertainties about the exact composition of the samples taken from Earth’s satellite by the NASA astronauts.

There is still an outside probability that the Moon could be made of cheese, folks, according to the type of argument put forward by the sceptic-deniers.

But as we all know, that’s impossible, because the Moon landings were faked, and in fact, the Moon is only painted onto the sky dome, as it isn’t actually there any more as it was removed during an undocumented altercation between nuclear states some time in the 1990s.

Categories
Bad Science Climate Change Climate Chaos Global Singeing Global Warming Green Investment Green Power Hide the Incline Media No Pressure Non-Science Political Nightmare Regulatory Ultimatum Renewable Resource Science Rules The Data Unqualified Opinion

A Fairy Castle of Froth

Well, it would seem the wheels have definitely come off the Climate Change sceptic-denier trolley bus, and the passengers are raving, and metaphorically drowning in their own pus-riddled intellectual bile, judging by the spluttered, splattered comments I am receiving on this web log.

Wegman is going down (the anti-science, anti-Hockey Stick Wegman Report, you understand, not the man himself) – and I mean down; down to the depths of dissmissal and reproach, and scorn mountains will be heaped, and his “strange scholarship” will be ribbed and ridiculed and his assertions and claims fobbed off for ever more, it seems, by those whose opinions really count :-

https://deepclimate.org/2010/11/16/replication-and-due-diligence-wegman-style/

https://deepclimate.org/2010/09/26/strange-scholarship-wegman-report/

https://climatechangepsychology.blogspot.com/2010/11/turns-out-climate-skeptics-favorite.html

“Turns out climate skeptics’ favorite report (the Wegman Report) might not be as scientific as Congressman Joe Barton claims…”

We’re talking pit-wise plumbing here, the nether reaches of the pile of tried-and-rejected hypotheses. We’re talking dearie-dearie-me, what a mess have we got here, then ? :-

https://climateprogress.org/2010/11/21/wegman-exposed-experts-find-shocking-plagiarism-in-2006-climate-report-requested-by-joe-barton-r-tx/

Michael Mann was right. You, dear sceptic-deniers, are wrong. Even the Daily Mail newspaper says so, and don’t retort that, of course, the Daily Maelstrom is not exactly the Source of All Validity, and testily question why I trust the Daily Maul when it agrees with me, and not otherwise :-

https://www.dailymail.co.uk/news/article-1332347/Influential-climate-change-report-copied-Wikipedia.html?ito=feeds-newsxml

“Influential climate change report ‘was copied from Wikipedia’ : By DAILY MAIL REPORTER : 23rd November 2010 : Research questioning the validity of global warming was copied from Wikipedia and textbooks, it has been claimed. A report by statistician Edward Wegman criticised earlier research led by scientist Michael Mann that said global temperatures were highest in the last century than the previous 1,000 years. But according to plagiarism experts, ‘significant’ sections of the 91-page report were lifted from ‘textbooks, Wikipedia and the writings of one of the scientists criticised in the report’…”

You can take or leave your truth universe, and the Daily Mall certainly does that, but I’ll stick with the data, thanks, the hard-won, carefully-kept, un-fudged, un-compromised actual measurements…

Categories
Bad Science Climate Change Global Warming Non-Science Science Rules The Data Tree Family

Hot Old Forests

https://www.theregister.co.uk/2010/11/12/global_warming_good_for_rainforests/

The Register reports that way back, way back, when the rainforests were good and hot, they prospered and life proliferated.

“Global warming is actually good for rainforests, say boffins” reads the headline from Lewis Page, “plus 3 degrees C, 1000 parts per million Carbon Dioxide did jungles a world of good last time”.

Not quite, Lewis old chap. Not quite.

1. The change in global temperatures at the Paleocene-Eocene border was only “rapid” in geological time – at around 20,000 years for the whole event. Plenty of time for rainforests to adapt. Not like now.

2. “There is no evidence for enhanced aridity in the northern Neotropics”, says the Abstract of the research paper “Effects of Rapid Global Warming at the Paleocene-Eocene Boundary on Neotropical Vegetation” by Jaramillo C. et al., in Science, 12 November 2010, Volume 330. Number 6006, Pages 957 – 961, DOI: 10.1126/science.1193833

Yet evidence of severe droughts in the Amazonian rainforest area today makes the analogy with the Paleocene-Eocene Thermal Maximum rather thin. With the current incredibly fast rate of warming in South America, it’s unlikely that regular, intense, droughts are going to reduce in the rainforest area.

Added to the current data, there is every reason to believe that the climate in the tropics was very different at the time of the PETM – the Americas had not yet met, and no Gulf Stream northwards existed.

3. “”It is remarkable that there is so much concern about the effects of greenhouse conditions on tropical forests,” says Jaramillo’s Smithsonian colleague Klaus Winter”, write Lewis Page. Klaus, who ? He’s not even listed on the research paper author listing. Does Mr or Dr Winter have anything to do with this research ? Why does Lewis Page quote hiim ?

4. Have you seen the organisations that contributed to this research ? They include “Colombian Petroleum Institute”, “Petróleos de Venezuela S.A.” and “Agencia Nacional de Hidrocarburos, Bogotá, Colombia” and a number of mining companies. What do they want out of research into rainforest productivity 55 million years ago ?

5. Have we talked about the massive extinction of animal life that took place at the PETM ? Well, perhaps we should…

I wonder what Dr Simon Lewis, rainforest expert, will make of this latest “atrocity” from The Register ?
[ UPDATE : The Daily Mail reported Dr Simon Lewis’ views some way down in an article on the subject here. By e-mail, Dr Simon Lewis wrote to me, “[One] obvious point is they are happy to extrapolate 56 million years to now from three points in a tiny corner of South America, which is a bit different from their usual views about historical proxy data…” ]

When I get the access to this report, I will need to delve deeper into the reasons why Lewis Page has proved, once again, that he doesn’t understand current Climate Change science, and doesn’t understand why the climates of yesteryear often have very little to say about the climate of today and tomorrow.

Categories
Bad Science Bait & Switch Carbon Capture Carbon Commodities Carbon Taxatious Climate Change Climate Chaos Corporate Pressure Delay and Deny Disturbing Trends Divide & Rule Emissions Impossible Energy Change Energy Revival Engineering Marvel Extreme Weather Financiers of the Apocalypse Fossilised Fuels Genetic Muddyfixation Geogingerneering Global Singeing Global Warming Low Carbon Life Major Shift Media Money Sings No Pressure Non-Science Nuclear Nuisance Nuclear Shambles Oil Change Optimistic Generation Peak Emissions Peak Energy Peak Oil Political Nightmare Realistic Models Regulatory Ultimatum Science Rules Social Change The Data Unqualified Opinion

We Will Get To You

Video Credit : Brooklyn Space Program

Eventually we will reach you.

Scientists are proverbially poor at communication, but we will eventually be able to explain to you what is happening to the Earth in a way that you will understand.

You need to give some time to the data, to the arguments. You need to read the significant research papers, learn how to read graphs, learn the acronyms, abbreviations, technical terms.

You will need to be able to weigh in your mind the significance of probabilities, the risks of extremes, the trends, the changing patterns.

After a while, you will start to reappraise the evidence, and start looking into the data and see the conclusions for yourself.

You will begin to appreciate the strong line of reasoning, and come to be in awe of the minds of many who work on Climate Change.

I’ve become impressed by the body of scientific evidence, that’s why I will always be aligned with the Climate Change science community.

We’re not going anywhere. We’re here, and we’re right. There has already been significant change in the Earth’s climate due to humankind’s mining-to-burn activities, and the projections are for further, possibly very dangerous change.

The scientists know what the problems are, and what the engineering solutions are. Some companies/corporations, economists and politicans and sadly even some compromised “environmentalists” promote non-solutions like carbon pricing, Carbon Taxation, Carbon Trading, Carbon Capture (and Storage), GM Crops, Nuclear Power, geoengineering – but the academies of scientists are telling you they won’t work, or won’t solve all the problems.

What is needed is wholesale removal of Fossil Fuels from the global economy in order to prevent further deterioration and disruption in the global climatic conditions. Either BP, Shell, Chevron and ExxonMobil hang up their boots forever, or they need to embrace new clean energies (not Nuclear Power) to stay in business.

Oil, gas and coal depletion in the production facilities of those countries that are national players will mean that they will go bust, because a consistently high price for Fossil Fuels is not supportable, because the global economy is so Fossil Fuel-dependent currently. This is both a buyer’s market and a seller’s market, so the price will be governed by the operation of this two-sided cartel, not by the theories of “scarcity economics”.

Either Saudi Arabia, Iraq, Iran, China, Venezuela and so on are on their way to extreme poverty, or they will embrace new clean energies (not Nuclear Power) to stay economically developed.

Meanwhile, the project of empirical scientific enquiry continues apace, and even though rich fossil fuel businesses are financing doubt, even though people with pension funds in mining pour scorn on Climate Change science, and even though the mainstream media can’t recognise uneducated propaganda when they meet it; you need to trust the intellectual community of Climate Change science researchers.

Stop listening to accusations of malpractice, dodgy data, weak methods, poor models. Do you really know what you are talking about when you pass judgement on the scientific community ? Who told you that scientists were wrong ? Can you really trust the people who tell you not to trust the scientific community ? Do you have the right or the authority to lay somebody else’s fabricated blame at the door of those whose whole lives are devoted to discovering the truth ?

Why don’t you do an integrity check on your sources, before replicating myths ?

Read the science journals and not the newspapers, is my advice.

And when it comes to the Internet, search wisely. You can’t believe every website you come across – there are some web loggers who are misled, and there are others seeking to mislead.

If you want to filter out the nonsense, try this :-

True Science

Categories
Be Prepared Climate Change Climate Chaos Disturbing Trends Eating & Drinking Extreme Weather Floodstorm Food Insecurity Global Warming Incalculable Disaster Landslide Mudslide Neverending Disaster Rainstorm Screaming Panic Social Chaos The Data

The Year of Unceasing Rain (4)

Irony alert ? “Typhoons ? They happen all the time. It’s just a little local storm. Nothing to worry about. Happens every season or so. The locals know how to read the warning signs, and head to high ground or build their huts on stilts. Power lines down ? Oh, they’ll be strung back up in no time. And the rice paddies will benefit from all that extra rain.”

Watch out China – here comes Megi :-

Categories
Advancing Africa Be Prepared Big Picture Climate Change Climate Chaos Disturbing Trends Eating & Drinking Freshwater Stress Global Singeing Global Warming Neverending Disaster Science Rules The Data Water Wars

Watering Hole


Image Credit : UCAR

People, animals and crops are likely to lose their favourite watering holes over the next few decades, not just in “poor” countries, but just about everywhere :-

https://www2.ucar.edu/news/climate-change-drought-may-threaten-much-globe-within-decades

The growing hole in water supplies is going to interfere with food security, and it’s going to interfere with human community survival, but it’s also going to interfere with energy production. In fact, it’s doing that already, as competition for water in Peru between food, grazing, people and energy shows most clearly :-

https://www.guardian.co.uk/global-development/poverty-matters/2010/sep/21/climate-wars-machu-picchu-irrigation
https://www.guardian.co.uk/global-development/video/2010/sep/23/peru-asparagus-wells-run-dry

What’s the story on the United Kingdom ? :-

https://www.physorg.com/news/2010-10-farmings.html

“Adapt now to keep farming’s water flowing : October 20, 2010 : Agricultural and horticultural businesses could face damaging water shortages in the coming decades as a result of climate change. Adaptation across the whole industry is needed to meet the impending challenge…”

https://www.reuters.com/article/idUSTRE69H4PS20101018

“UK crops to face water supply crunch, may relocate : LONDON | Mon Oct 18, 2010 : …Agricultural crops in Britain may need to be moved to new areas as the threat of both drought and flooding rises in the coming decades, a report commissioned by the Royal Agricultural Society of England said on Monday. The report said climate change was expected to produce higher temperatures, drier summers and wetter winters across much of England. “This is likely to mean reduced river flow and less water available for agriculture,” said one of the report’s authors, Alison Bailey, of the University of Reading’s School of Agriculture, Policy and Development…”

And the United States of America ? :-

https://www.skepticalscience.com/climate-change-impacts-on-CA-water-resources.html

“…The study found that water withdrawals in California are estimated to be greater than 100% of the available precipitation in 2050…”

https://www.doi.gov/news/pressreleases/Secretary-Salazar-Launches-New-Regional-Climate-Science-Center-and-Water-Census-at-Meeting-of-Colorado-River-Basin-Water-Leaders.cfm

“…10/20/2010 : Contact: Joan Moody : PHOENIX, AZ—At a meeting of water leaders from the seven Colorado River Basin states in Phoenix today, Secretary of the Interior Ken Salazar announced that the Department of the Interior has chosen the University of Arizona as home base for a regional Climate Science Center and selected the Colorado River Basin for the launch of the first U.S. water census since 1978. “The Colorado River Basin is ground zero for assessing the effects of climate change on our rivers and taking creative management actions to head off the related dangers posed to our water supplies, hydroelectric power generation and ecosystems,” the Secretary said. “We are with you for the long haul to protect our region and its water.”…”

https://www.uusc.org/content/examining_water_crisis_and_climate_change

“Examining the Water Crisis and Climate Change : UUSC understands that there is a global water crisis, which is the product of shifting and competing political and economic interests, depletion from environmental contamination, climate change, over-extraction, and increasing human population. As a human-rights organization, UUSC recognizes the urgent need to respond. Climate justice is a central theme of UUSC’s Environmental Justice work. More people are losing their access to clean, affordable water in the United States and in other nations, and too often, the victims are people in low-income communities, women, and racial and ethnic minorities…”

Categories
Bad Science Climate Change Global Warming Media Non-Science Science Rules The Data

BBC : Licence to Manipulate ?

Another Earth-shatteringly ridiculous piece on the practice of Climate Change science has dribbled from the loudspeaker of the BBC :-

https://www.bbc.co.uk/news/uk-politics-11574503
“Doubts over scientists’ climate change debate claims”

Why am I surprised that they seem content to repeat falsehoods and rehearse a patronising tone ?

Where’s the proper investigative journalism ? Why get somebody so young and fresh-faced as Adam Fleming to tear up his good reputation so soon into his career ? I mean, he’s only done kids’ TV before now, as far as I know. Why was he only briefed with Climate Change “sceptic” fantasy nonsense ? And what will the University of East Anglia Press Office do to react ?

=x=x=x=x=x=x=x=x=x=x=x=x=x=x=x=x=x=x=x=x=x=x=x=

Date: Tue 19 Oct 2010
From: Jo Abbess
Subject: The BBC Gets It Completely Wrong Once Again
To: Climatic Research Unit, University of East Anglia Pres Office

Dear Press Office at CRU UEA,

I am completely astonished at the paucity of the latest
offering from the BBC on so-called “Climategate” (see
forwarded e-mail I have sent to Professor Phil Jones).

I would see this as a prime moment to correct the BBC
publicly, and you could be the people for the job, which is
why I am drawing this to your attention.

I’m sure you don’t need me to pinpoint the inaccuracies in the
BBC piece, but I can offer comments if you would like to hear
them.

Regards,

Jo Abbess

=x=x=x=x=x=x=x=x=x=x=x=x=x=x=x=x=x=x=x=x=x=x=x=

Date: Tue, 19 Oct 2010
From: Jo Abbess
Subject: The BBC Gets It Completely Wrong Once Again
To: Professor Phil Jones
Cc: Dr Ben Santer, Dr Gavin Schmidt

Dear Professor Jones,

I can’t help asking myself why it is that the BBC has got
Climate Change science so, so wrong yet again.

Can’t they read ? And who have they been listening to ?

This is a really appalling re-write of recent history from the
BBC (see below). It’s insulting, judgemental and just plain
inaccurate.

They couldn’t have done worse if they had been deliberately
trying to be annoying, in my view.

https://www.bbc.co.uk/news/uk-politics-11574503
“Doubts over scientists’ climate change debate claims”

I counted at least 10 “revisions of history” in a piece of
film shorter than an ad break.

Surely some of your colleagues have the energy left to
complain ?

=x=x=x=x=x=x=x=x=x=x=

TEXT ON WEB PAGE

19 October 2010
Last updated at 13:48

Press coverage has cast further doubt on climate scientists’
claims that man-made global warming is real and adversely
affecting the planet.

Polls show that the public are becoming increasingly confused
about the issue. Adam Fleming reports.

=x=x=x=x=x=x=x=x=x=x=

TRANSCRIPT OF AUDIO IN FILM PRESENTATION

It’s the year that “uncertainty” became the buzzword in the
climate change debate, even for scientists who are convinced
that human activity is warming the planet.

Last year saw the publication of private e-mails written in
these buildings, the Climatic Research Unit at the University
of East Anglia. Experts spoke of doing “tricks” with numbers.
They hinted at the deletion of data that didn’t fit their
theories.

This summer, an inquiry, the last of three, left the
scientists’ reputation intact, but told them that they had to
be more honest about how they reach their conclusions.

Then came “Glaciergate”. In 2007 the Intergovernmental Panel
on Climate Change, the group of international scientists that
inform global environmental policy, had written a report
saying that most of the glaciers in the Himalyas could melt by
2035, but that was proved to be wildly inaccurate.

The head of the IPCC, the Indian academic Rajendra Pachauri
came under pressure to quit. In future [the] chairman will
serve just one term, and again the academics were told to be
more honest about the question marks in their research.

Back at home, David Cameron has pledged the “greenest
Government ever”, but there are limits This week the Coalition
announced it wouldn’t fund tidal power in the Severn Estuary
because the bill was too high.

=x=x=x=x=x=x=x=x=x=x=

Met vriendelijke groeten,

jo.

Categories
Acid Ocean Be Prepared Big Picture Breathe Easy British Sea Power Climate Change Coal Hell Corporate Pressure Cost Effective Dead Zone Direction of Travel Eating & Drinking Emissions Impossible Energy Change Energy Revival Engineering Marvel Feel Gooder Fossilised Fuels Geogingerneering Global Warming Green Investment Growth Paradigm Human Nurture Low Carbon Life Major Shift Money Sings Oil Change Optimistic Generation Peak Emissions Renewable Resource Science Rules Social Change Solar Sunrise Stirring Stuff Technological Sideshow The Data Transport of Delight Wind of Fortune

Dearth of the Oceans

An incomplete recording of the BBC Horizon programme “The Death of the Oceans ?” narrated by David Attenborough is below.

It’s about Global Warming, of course (and overfishing, and sonar making whales deaf – which is the bit that’s missing at the end). But it’s also about Global Warming’s evil twin – Ocean Acidification.

Believe what you will about the Anthropogenic component of Global Warming, and I know some of you resist the Science as if it were a hairy, sweaty, alcoholic dentist threatening to pull your teeth without Novocaine, but there’s no way you can deny that the increasing concentration of Carbon Dioxide in the atmosphere, most of it a direct result of humankind’s burning of Fossil Fuels, is turning the Oceans into a giant bucket of fizzy soda, and is threatening marine life, which is a huge risk to the whole of Life on Earth.

The only solution is to stop burning so much Coal, Oil and Gas. Really, that’s the only way.

Oh, you can fight this inevitability with every brain circuit you have, trying to force others to believe that everything’s still OK, that the Earth is not dangerously heating up, that Life on Land and in the Oceans is not on the cusp of mass extinction, and that Progress is just fine, and Economic Recovery, or Shiny New Technology, or Geoengineering will save us, but one day you will understand. You will accept. The global systems of production, transport and agriculture have to change. The Carbon-based Industrial Age will be gone in only a few decades, only a couple of hundred years after it started.

You can relax. Everything will be fine – eventually. When we have Wind Farms on every ridge top, Solar Power plants in every desert, Geothermal stations in our Town Halls, Combined Heat and Power running on Biomass in every street, Marine Power-gathering machines, Organic food, small electric cars, useful 24 hours-in-a-day networks of electricity-powered public transportation. The time is coming for the new human world to be born – and it will be green, clean and less energy-hungry than before.

It’s going to be a bit of a traumatic birth and the Climate Medics are working hard in the delivery suite, but soon, very soon, Green Investment will see the light of day – those who are wealthy will, as one, put their finances towards Renewable Energy and Energy-efficient machines and Energy Demand Management, real assets, with real returns on investment, and the future will be secured.

Part 1/4
https://www.youtube.com/watch?v=d4rloPBrA6w

See at top for video.

Part 2/4
https://www.youtube.com/watch?v=fdn1RpqKziE

Part 3/4
https://www.youtube.com/watch?v=nKPNcQyljds

Part 4/4
https://www.youtube.com/watch?v=uIKOKG3L3zo

Categories
Bad Science Bait & Switch Climate Change Global Warming Media Non-Science Science Rules Social Change The Data

The Register : Can’t Read, Won’t Read ?

Is something ailing The Register’s Lewis Page ? Despite having access to the text of a recent research paper about the Sun’s recent output, and its short-term impact on surface temperatures on Earth, and having had plenty of time to read plain English reviews of the paper’s findings in everyday language, he still writes it up poorly (in my humble opinion). Could this be due to internal bias, I ask myself ? Or is Lewis Page being wilfully contrarian ? Who can say ?

Categories
Acid Ocean Animal Kingdoom Dead Zone Disturbing Trends Environmental Howzat Fossilised Fuels Global Warming Peak Emissions Science Rules The Data Toxic Hazard

Michaelmas Gracie

Welcome to little Gracie, born at Michaelmas.

By the time this child is five years old, the world should have agreed to control Carbon Dioxide emissions.

Net greenhouse gas emissions to air should have peaked, and be on the decline by the time this child starts school.

It’s up to us to care for our children.

If we don’t take steps to stop the ocean becoming increasingly acidic, we will have destroyed part of the food chain, and people will go hungry in greater numbers than they do now :-

https://www.sciamdigital.com/index.cfm?fa=Products.ViewIssuePreview&ARTICLEID_CHAR=F50CF08B-237D-9F22-E86BA2E071920760

“August 2010 : Scientific American Magazine : Threatening Ocean Life from the Inside Out; August 2010; Scientific American Magazine; by Marah J. Hardt and Carl Safina : …As researchers, we were concerned about the underappreciated effects of changing ocean chemistry on the cells, tissues and organs of marine species. In laboratory experiments at the University of Gothenburg in Sweden, Havenhand had demonstrated that such changes could seriously impede the most fundamental strategy of survival: sex. Ocean acidification—a result of too much carbon dioxide reacting with seawater to form carbonic acid—has been dubbed “the other CO2 problem.” As the water becomes more acidic, corals and animals such as clams and mussels have trouble building their skeletons and shells. But even more sinister, the acidity can interfere with basic bodily functions for all marine animals, shelled or not. By disrupting processes as fundamental as growth and reproduction, ocean acidification threatens the animals’ health and even the survival of species. Time is running out to limit acidification before it irreparably harms the food chain on which the world’s oceans—and people—depend.”

And global warming will only make the problem worse :-

https://www.nature.com/ngeo/journal/v2/n2/full/ngeo420.html

Letter : Nature Geoscience 2, 105 – 109 (2009)
Published online: 25 January 2009 : doi:10.1038/ngeo420

“Long-term ocean oxygen depletion in response to carbon dioxide emissions from fossil fuels”

Gary Shaffer, Steffen Malskær Olsen & Jens Olaf Pepke Pedersen

“Abstract : Ongoing global warming could persist far into the future, because natural processes require decades to hundreds of thousands of years to remove carbon dioxide from fossil-fuel burning from the atmosphere. Future warming may have large global impacts including ocean oxygen depletion and associated adverse effects on marine life, such as more frequent mortality events, but long, comprehensive simulations of these impacts are currently not available. Here we project global change over the next 100,000 years using a low-resolution Earth system model, and find severe, long-term ocean oxygen depletion, as well as a great expansion of ocean oxygen-minimum zones for scenarios with high emissions or high climate sensitivity. We find that climate feedbacks within the Earth system amplify the strength and duration of global warming, ocean heating and oxygen depletion. Decreased oxygen solubility from surface-layer warming accounts for most of the enhanced oxygen depletion in the upper 500 m of the ocean. Possible weakening of ocean overturning and convection lead to further oxygen depletion, also in the deep ocean. We conclude that substantial reductions in fossil-fuel use over the next few generations are needed if extensive ocean oxygen depletion for thousands of years is to be avoided.”

Categories
Bad Science Bait & Switch Big Picture British Sea Power Climate Change Climate Chaos Cost Effective Design Matters Divide & Rule Energy Change Energy Revival Engineering Marvel Fossilised Fuels Global Warming Low Carbon Life Non-Science Nuclear Nuisance Nuclear Shambles Public Relations Renewable Resource Science Rules Social Change Social Chaos Stirring Stuff The Data Unqualified Opinion Wasted Resource Wind of Fortune

Wind Power : Material Fatigues

Image Credit : Cape Cod Living

James Delingpole follows in a long line of commentators with zero engineering experience in pouring scorn on a technology that could quite possibly save our skins :-

https://blogs.telegraph.co.uk/news/jamesdelingpole/100056158/wind-farms-yet-another-brewing-disaster/

I don’t know what he harbours in his heart against wonderful wind turbines, but he seems to be part of a movement who delight in their failure. Just ask the Internet to show you “exploding wind turbines”.

For example :-

https://www.youtube.com/watch?v=HKkTUY2slYQ
https://www.youtube.com/watch?v=7nSB1SdVHqQ
https://www.youtube.com/watch?v=rkGXoE3RFZ8
https://www.youtube.com/watch?v=MOfHxINzGeo

Clearly, you need to be in full protective fatigues when battling this kind of bad press…in fact “fatigue” is exactly the right word to come back at Mr Delingpole’s cracked warning (of cracks in wind turbine bases).

Categories
Breathe Easy Climate Change Corporate Pressure Disturbing Trends Emissions Impossible Energy Change Environmental Howzat Global Warming Health Impacts Low Carbon Life Protest & Survive Social Change Technological Sideshow The Data Toxic Hazard Zero Net

A Combustion-free Future

Combustion of Fossil Fuels and Biomass is a major cause of chronic respiratory problems around the world.

Many people seem to know that smoky stoves in the Global South cause lung disease for millions of children in poverty.

But what will happen as more so-called Renewable Energy is built in the United Kingdom ?

This answer from Almuth Ernsting points the way :-

“Forth Energy have put in a planning application for a power station in Dundee which will burn 1 million tonnes of mainly imported wood per year. Altogether, they want to build four power stations in Scotland which will burn a total of 5.3 million tonnes. That’s the equivalent of nearly two-thirds of the UK’s annual wood production. Such a large new demand for wood will, directly and/or indirectly, mean more industrial tree plantations and more logging at the expense of forests, climate and communities. If approved, Forth Energy’s power stations would attract an estimated £300 million in subsidies every year – paid as “Renewable Obligation Certificates” through a levy on electricity bills. Local residents would be affected by more air pollution in a city with already high levels of pollution. There are also serious concerns about the impacts on the Firth of Tay and Eden Estuary,which is a Special Area of Conservation. There has been a large number of objections from residents in Dundee already. To read more background information and to object to the application through our webform, please go to: https://www.biofuelwatch.org.uk/forthsep2010.php

The solution : stop burning things to make energy ! It’s really, really simple. Use Wind Power, Solar Power, Wave Power, Tidal Power, Geothermal Power…

“The Two Marks” – Mark Delucchi and Mark Jacobson make similar arguments :-

Categories
Bait & Switch Be Prepared Climate Change Corporate Pressure Cost Effective Delay and Deny Divide & Rule Global Singeing Global Warming Media Peace not War Political Nightmare Protest & Survive Public Relations Regulatory Ultimatum Science Rules Screaming Panic Social Change The Data Uncategorized Unsolicited Advice & Guidance Unutterably Useless Utter Futility Vain Hope Vote Loser

Chin Up, George Monbiot !

George Monbiot looks back in regret at Copenhagen :-

https://www.guardian.co.uk/commentisfree/2010/sep/20/climate-change-negotiations-failure

“…The closer it comes, the worse it looks. The best outcome anyone now expects from December’s climate summit in Mexico is that some delegates might stay awake during the meetings. When talks fail once, as they did in Copenhagen, governments lose interest. They don’t want to be associated with failure, they don’t want to pour time and energy into a broken process. Nine years after the world trade negotiations moved to Mexico after failing in Qatar, they remain in diplomatic limbo. Nothing in the preparations for the climate talks suggests any other outcome…”

Copenhagen was never seriously going to deliver, and I don’t think most of the protesters on the streets in Copenhagen thought so. Activist demands, including from activist nations, were always going to be ignored, The solutions really didn’t come to the conference, and the problems really lay elsewhere.

But there’s no need to utterly despair, George !

Categories
Bait & Switch Climate Change Delay and Deny Divide & Rule Global Warming Media Public Relations Science Rules Social Change The Data Unqualified Opinion

Rajendra Pachauri Must Stay !

Dr Rajendra Pachauri, you know, he’s like everybody’s grandfather.

Some report he’s a bit irritating, awkward, even, but that’s only when he has to respond to deliberately riling Media questions and smear campaigns.

His heart’s in the right place, he’s good at motivating people, he can see the big picture, he’s actually a very good communicator, and he’s done a lot to take the Intergovernmental Panel on Climate Change forward.

That’s no reason for various voices in the Media to start a new round of calling for his head. “Resign !” cry the so-called “libertarian” commentators, those voices that perversely reason that if Pachauri resigns, or gets tipped out, that it will set the IPCC back five years.

What we desperately need now is stability in the organisation of the IPCC – the Fifth Assessment Report will be monumental enough without the organisation having to adapt to a new leader that needs to learn how to corral everybody into good and productive working relationships.

Categories
Climate Change Extreme Weather Floodstorm Global Warming Rainstorm The Data

The Year of Unceasing Rain (2)

It just won’t stop raining violently this year. And it’s raining violently everywhere.

Typhoon Fanapi could be China’s worst storm this year :-

https://www.bloomberg.com/news/2010-09-19/china-steps-up-emergency-response-for-typhoon-fanapi-as-storm-nears-coast.html
https://www.upi.com/Top_News/World-News/2010/09/19/Typhoon-Fanapi-hits-Taiwan/UPI-35521284870548/

And in the next few days, the double-hearted spinner of Hurricanes Igor and Julia could cause some nasty downpours in the Eastern Seaboard of the United States :-

https://www.google.com/hostednews/ap/article/ALeqM5gVWjsPEiqe1tEu2mhBIRaxxGi8owD9IB86D00

Meanwhile, in the South Pacific, “a storm the size of Australia” has just brought misery to New Zealand :-

https://uk.news.yahoo.com/5/20100919/twl-storm-the-size-of-australia-hits-new-3fd0ae9.html
https://news.sky.com/skynews/Home/World-News/Storm-Size-Of-Australia-Hits-New-Zealand-Leaving-Thousands-Without-Power-And-Stadium-Crashing-Down
https://news.smh.com.au/breaking-news-world/new-zealanders-powerless-as-storm-buffets-nation-20100918-15guz.html

Hurricane Karl brought storms to Mexico :-

https://content.usatoday.com/communities/sciencefair/post/2010/09/nasa-images-of-hurricane-karl-as-it-hits-mexico/1

Tornadoes hit New York City during storm :-

https://www.longislandpress.com/2010/09/19/tornadoes-in-nyc-nyc-gets-two-tornadoes-in-storm/

Categories
Climate Change Global Warming Science Rules The Data

Mini Hockey Sticks (4)

Totally new data set – totally new temperature proxy – totally the same Hockey Stick.

Michael Mann, Phil Jones and all the experts are more than vindicated.

Steve McIntyre, Marc Morano, and your “tribes”, will you stand aside, please ?

You’re just getting in the way of the true course of discovery.

Categories
Advertise Freely Big Picture Climate Change Climate Chaos Corporate Pressure Extreme Weather Floodstorm Global Singeing Global Warming Heatwave Incalculable Disaster Meltdown Neverending Disaster Oil Change Political Nightmare Protest & Survive Regulatory Ultimatum Science Rules Screaming Panic Social Change The Data

This Is What Overwarming Looks Like

https://vimeo.com/15028423

“We have to believe what we are witnessing with our own eyes — floods, fires, melting ice and feverish heat: from smoke-choked Moscow to water-soaked Pakistan, to soaring temperatures in the US and a deteriorating landscape in the High Arctic, our planet seems to be having a breakdown. It’s not just a portent of things to come but real signs of very troubling climate change already under way.”

https://switchboard.nrdc.org/blogs/dlashof/this_is_what_global_warming_lo.html

NRDC Advocacy Website

“Tell Congress not to weaken Clean Air Act protections : As the EPA prepares to set standards for global warming pollution from power plants, refineries and other major polluters, some members of Congress want to weaken the Clean Air Act and give industries free rein to dump harmful pollution into our air…”

https://www.treehugger.com/files/2010/09/37-states-set-nighttime-high-temperature-records-this-summer.php

“With January to August 2010 found to be tied for the hottest year on record by NOAA, new analysis from NRDC shows that it wasn’t just daytime temperatures that’ve been soaring. In fact, 37 states in the US set record high nighttime temperatures this summer…”