Categories
Bad Science Bait & Switch Conflict of Interest Cost Effective Dead End Delay and Deny Demoticratica Direction of Travel Disturbing Trends Divide & Rule Fair Balance Freak Science Global Heating Global Singeing Global Warming Human Nurture Libertarian Liberalism Mass Propaganda Media Money Sings Non-Science Nudge & Budge Policy Warfare Political Nightmare Public Relations Pure Hollywood Science Rules Scientific Fallacy Social Capital Social Change Social Chaos Sustainable Deferment The Data The War on Error Unqualified Opinion

Everyone’s Entitled to their Opinion

Yes, indeed they are. Everyone is entitled to hold their own particular opinion. In this democracy of ideas, every longshot, wingnut, bonehead, rogue, charlatan, conspiracy theorist, crank, crony and astroturfer should be permitted access to the microphone on the stage. If we hold a public meeting about immigration, we should, of course, invite a white supremicist, a member of the British National Party, and a Daily Mail journalist to offer us their wise words. If we hold a sociological symposium on the Second World War, we should of course invite a Holocaust-denier. If an engineering conference, a cold fusion-in-a-test-tube enthusiast. Of course we should provide balance, as much balance as possible, and offer wisdom, insight and rant from all ends of all spectra. It’s only reasonable.

It therefore goes without question that somebody from the Global Warming Policy Foundation “think tank”, so copiously and generously sponsored by a person or persons unknown, should be invited to speak on the platform, or in a panel, at a well-funded quasi-establishment meeting on Climate Change. Regardless of a complete lack of training in atmospheric physics, or even knowledge of the span of the last five years in the science of global warming, naturally, a GWPF man must be invited by GovToday to a presitigious conference to be held on 29th November 2011 in the City of London grandly entitled “2011 Carbon Reduction : The Transition to a Low Carbon Economy”.

Categories
Bad Science Bait & Switch Climate Change Delay and Deny Global Warming Science Rules Scientific Fallacy

Slaying the Climate Ghouls

They may have been BESTed, but the climate change denier spooks and ghouls are still fluttering about like deranged rabid bats. Here is a draft of a letter I am considering sending to somebody in an organisation under which I serve…

31st October 2011

Dear XXXXXXXXXXX,

It seems to me that you are labouring under several false impressions of the consensus in science regarding global warming and climate change. For example, you do not appear to accept that global warming is taking place, a fact that is evidenced by over a century of data. And as another example, you do not appear to accept that global warming is causing climate change, a scientific reality evidenced by countless studies. However, I’m not going to guide you to the peer-reviewed science for those points. All I want to do in this particular communication is offer you a popular critique of one of your key arguments, and challenge you to check your sources.

Categories
Advancing Africa Bad Science Bait & Switch Be Prepared Behaviour Changeling Big Picture Burning Money Carbon Army Carbon Capture Carbon Commodities Carbon Taxatious Climate Change Conflict of Interest Corporate Pressure Cost Effective Delay and Deny Demoticratica Direction of Travel Droughtbowl Eating & Drinking Economic Implosion Efficiency is King Emissions Impossible Energy Change Energy Insecurity Evil Opposition Faithful God Feed the World Financiers of the Apocalypse Food Insecurity Foreign Interference Foreign Investment Fossilised Fuels Freak Science Freemarketeering Geogingerneering Global Warming Green Investment Human Nurture Hydrocarbon Hegemony Low Carbon Life Major Shift Mass Propaganda Media Military Invention Money Sings Neverending Disaster No Blood For Oil Non-Science Not In My Name Nudge & Budge Oil Change Peace not War Peak Emissions Peak Energy Peak Oil Petrolheads Policy Warfare Political Nightmare Public Relations Realistic Models Regulatory Ultimatum Science Rules Scientific Fallacy Social Capital Social Change Solution City Stop War Sustainable Deferment Technofix Technological Fallacy Technological Sideshow Technomess The Data The Myth of Innovation The War on Error Unqualified Opinion Unsolicited Advice & Guidance Unutterably Useless Utter Futility Vain Hope Voluntary Behaviour Change Wasted Resource

The Problem of Powerlessness #2

On Wednesday, I received a telephone call from an Information Technology recruitment consultancy. They wanted to know if I would be prepared to provide computer systems programming services for NATO.

Detecting that I was speaking with a native French-speaker, I slipped into my rather unpracticed second language to explain that I could not countenance working with the militaries, because I disagree with their strategy of repeated aggression.

I explained I was critical of the possibility that the air strikes in Libya were being conducted in order to establish an occupation of North Africa by Western forces, to protect oil and gas interests in the region. The recruitment agent agreed with me that the Americans were the driving force behind NATO, and that they were being too warlike.

Whoops, there goes another great opportunity to make a huge pile of cash, contracting for warmongers ! Sometimes you just have to kiss a career goodbye. IT consultancy has many ethical pitfalls. Time to reinvent myself.

I’ve been “back to school” for the second university degree, and now I’m supposed to submit myself to the “third degree” – go out and get me a job. The paucity of available positions due to the poor economic climate notwithstanding, the possibility of ending up in an unsuitable role fills me with dread. One of these days I might try to write about my experiences of having to endure several kinds of abuse whilst engaged in paid employment : suffice it to say, workplace inhumanity can be unbearable, some people don’t know what ethical behaviour means, and Human Resources departments always take sides, especially with vindictive, manipulative, micro-managers. I know what it’s like to be powerless.

Categories
Big Society Carbon Capture Carbon Commodities Carbon Taxatious China Syndrome Climate Change Climate Damages Engineering Marvel Evil Opposition Feel Gooder Foreign Interference Mass Propaganda Military Invention Money Sings National Socialism Nuclear Nuisance Nuclear Shambles Peace not War Pure Hollywood Science Rules Stirring Stuff The War on Error Wasted Resource

China Launches : Space Republic

China has launched Tiangong-1, the “Heavenly Palace“, and demonstrated an international co-operative republic of space in the making. Many technologists, scientists, engineers and military personnel in the major economies will have taken part in the coordination of this project.

Three things come to mind. First of all, China are going to experience a massive drain on domestic economic and social development in pursuit of its programme to set up a space station. Some could say this is deliberate, and that China has been convinced to spend on space to keep them from world economic dominance.

Next, the Chinese are obviously going to set up Earth monitoring systems, and are going to find out that everything the Americans have said about environment and climate, based on the data from the NASA, NOAA and UAH satellites and space occupation, is accurate; and wonder why they were convinced of the possibility of the alternative, and the necessity of going up there to find out for themselves.

And thirdly, the Chinese are going to find that they are drawn into the American and United Nations economic and military security programmes, monitoring common “enemies” – such as those breaking carbon treaties and constructing disallowed nuclear power stations.

So, not a space republic – not even a space race. More, a space replication, repeating what’s already been done before. A giant public works project that should keep the hardworking Chinese people proud for a moment.

Happy Birthday, China !

Categories
Bad Science Bait & Switch Climate Change Delay and Deny Freak Science Global Heating Global Singeing Global Warming Hide the Incline Media Non-Science Science Rules

We Need To Talk About Delingpole

James Delingpole clearly hasn’t heard of Global Dimming – a phenomenon successfully attributed to airborne particles – usually called “aerosols” in the scientific literature. It was featured in a Horizon programme, I think, which aired on the television several years ago now, in 2007, if I recall correctly, and it’s since been cached in YouTube, and unsurprisingly even has its own Wikipedia page, where I think James could start a proper education :-

https://www.youtube.com/watch?v=bLfBXRPoHRc
https://www.youtube.com/watch?v=2e_XBwPHqz8
https://www.youtube.com/watch?v=ueaib127Ebk
https://www.youtube.com/watch?v=ayd5R2NkVcA
https://www.youtube.com/watch?v=yA74df19bWs

At the present, Delingpole seems to think that it’s somehow news that Chinese economic development is connected to increased dirt in the sky, and that this has a temporary dampening effect on Global Warming until the microscopic gritty bits fall out of the air into some unlucky kiddie’s lungs.

Categories
Bait & Switch Big Picture Biofools British Biogas Conflict of Interest Corporate Pressure Dead End Design Matters Direction of Travel Drive Train Efficiency is King Energy Change Energy Insecurity Energy Revival Energy Socialism Engineering Marvel Freemarketeering Human Nurture Incalculable Disaster Libertarian Liberalism Low Carbon Life Major Shift Mass Propaganda National Energy Neverending Disaster Non-Science Nuclear Nuisance Nuclear Shambles Nudge & Budge Oil Change Optimistic Generation Policy Warfare Political Nightmare Public Relations Realistic Models Renewable Gas Science Rules Scientific Fallacy Social Change Solar Sunrise Technofix Technological Fallacy Technological Sideshow Technomess The Myth of Innovation The Power of Intention The War on Error Transport of Delight Unutterably Useless Utter Futility Vain Hope Vote Loser Wind of Fortune

George Monbiot : New Clear

It is a newer, clearer tone that George Monbiot uses in his piece The nuclear industry stinks. But that is not a reason to ditch nuclear power. He seems to have lost his dirty annoyance with filthy anti-nuclear activists and moved onto a higher plane of moral certitude, where the air is cleaner and more refined.

He is pro-technology, but anti-industry. For him, the privately owned enterprises of atomic energy are the central problem that has led to accidents both of a radioactive and an accountancy nature. “Corporate power ?”, he asks, “No thanks.” The trouble is, you can’t really separate the failings of nuclear power from the failings of human power. It’s such a large, complex and dangerous enterprise that inevitably, human power systems compromise the use of the technology, regardless of whether they are publicly or privately owned. For a small amount of evidence, just look at the history of publicly-managed nuclear power in the United Kingdom. Not exactly peachy. And as for those who claimed that a “free” market approach to managing nuclear power would improve matters – how wrong they were. In my view, on the basis of the evidence so far, nobody can claim that nuclear power can be run as an efficient, safe, profit-making venture.

Categories
Advancing Africa Bad Science Bait & Switch Be Prepared Bee Prepared Big Picture Climate Change Climate Damages Conflict of Interest Corporate Pressure Dead End Disturbing Trends Divide & Rule Droughtbowl Eating & Drinking Environmental Howzat Feed the World Food Insecurity Foreign Interference Foreign Investment Freak Science Freshwater Stress Genetic Modification Genetic Muddyfixation Growth Paradigm Mass Propaganda Media Money Sings Non-Science Peak Energy Peak Oil Science Rules Scientific Fallacy Technofix Technological Fallacy Technological Sideshow Technomess The Myth of Innovation The War on Error Toxic Hazard Unutterably Useless Utter Futility Vain Hope Water Wars

Mark Lynas : Oxford Ragwort

Image Credit : Mark Holderness

Mark Lynas betrayed more of his intellectual influences this week, when he tweeted as @mark_lynas “Colony collapse disorder – honeybees – not quite the environmental story it seemed:
https://breakthroughjournal.org/content/authors/hannah-nordhaus/an-environmental-journalists-l.shtml

Hmmm. That’s a piece from a new generation of Nordhaus-es, Hannah, writing for the Breakthrough Institute, founded by Ted Nordhaus and Michael Shellenberger, authors of “The Death of Environmentalism“, a document I truly regret wasting the paper to print. As I read it, I started scratching hot red comments in the margins, so many, that in the end the pages were more red than black-and-white.

Hannah’s piece, like her book, “The Beekeeper’s Lament“, is more delicate and considered, I think, but still shreds decades of environmental thought and much science, without any justification in my view.

She writes, “…very quickly, many journalists settled on neonicotinoids — pesticides that are applied to more than 140 different crops — as the likely culprit. It seemed a familiar story of human greed and
shortsightedness. With their callous disregard for nature, big chemical companies and big agriculture were killing the bees — and threatening our own survival. The honey bee’s recent problems have occasioned a similar rush to judgment. Before any studies had been conducted on the causes of CCD, three books and countless articles came out touting pesticides as the malady’s cause. Had I been able to turn a book around quickly, I might have leapt to the same conclusions. But I was late to the party, and as more studies came out and I came to better understand the science, I became less and less convinced that pesticides provided a convincing explanation for beekeepers’ losses…”

Her argument appears to be that pesticides are bad for other pollinators, not bees; but that this makes life harder for the bees, who then have to do all that pollination instead :-

https://naturebeebookclub.wordpress.com/2011/05/02/the-beekeepers-lament-nordhaus-hannah/

“In steps John Miller, a boundingly energetic and charismatic beekeeper, who tasks himself with the care and the sustainable keeping of honeybees. He is descended from America’s first migratory beekeeper, N.E. Miller, who, at the beginning of the 20th century, transported thousands of hives from one crop to another, working the Idahoan clover in summer and the Californian almonds in winter. Back then beekeepers used to pay farmers to keep a few dozen hives on their land. But now farmers pay beekeepers millions of dollars to have their crops pollinated by upwards of ten thousand hives. With the rise of the monocrop and increasingly efficient pesticides, there are simply not enough natural pollinators to complete the massive task of sexing-up millions of acres of almond groves.”

This kind of writing seems to me like a lot of anti-green writing, where a straw man is set up, only to bow down and worship it. The central framework of fallacy appears to be :-

a. Environmentalists are zealous, and therefore crazy.
b. They believe pesticides are dangerous to bees.
c. They must be wrong, and pesticides can’t be all that bad for bees.

Let’s just read a little around that idea, shall we ? Let’s start with Wikipedia, just to make it easy :-

https://en.wikipedia.org/wiki/Pesticide_toxicity_to_bees

“For the majority of pesticides that are registered in the United States, EPA only requires a short-term contact toxicity test on adult honeybees. In some cases, the agency also receives short-term oral toxicity tests, which are required in Europe. EPA’s testing requirements do not account for sub-lethal effects to bees or effects on brood or larvae. Their testing requirements are also not designed to determine effects in bees from exposure to systemic pesticides. With Colony Collapse Disorder, whole hive tests in the field are needed in order to determine the effects of a pesticide on bee colonies. To date, there are very few scientifically valid whole hive studies that can be used to determine the effects of pesticides on bee colonies.”

Actually, it’s not just “mad environmentalists” who are concerned about the effect of pesticides on honeybees. Here’s just one scholarly paper :-

https://www.plosone.org/article/info%3Adoi%2F10.1371%2Fjournal.pone.0009754
“High Levels of Miticides and Agrochemicals in North American Apiaries: Implications for Honey Bee Health”, Mullin et el., 2010.

What has this got to do with Climate Change. I can hear you asking ?

Well, it’s like this – in order to do intensive farming, agricultural chemicals are used on crops. Specialised herbicides, pesticides and fungicides are used on genetically modified crops, along with chemical fertilisers.

In order to convince people to accept Genetically Modified food, they’ve got to be encouraged to believe that pesticides, herbicides and fungicides are really alright.

Hence, pesticides cannot be fingered as a problem for bees, otherwise people might not accept GM crops…

Yes, it’s coming back round to tampering with our food genes. And it’s being sold to us as a cure for Climate Change.

At the bottom of this page there’s a transcript of a snippet from a television programme I was unlucky and incensed enough to have viewed yesterday. Called “The Wonder of Weeds”, it took us through the basic logic of modern-day plant breeding, including the role for genetic modification of plants – without once mentioning the words “life sciences”, “bioengineering”, “biotechnology” or even “genetic modification”.

The GM crops are presented as being the saviour of humanity, without once mentioning why conditions in the world may be damaging crops in new ways in the future, a lot of which will be due to climate change.

There was the usual category error – of confusing science with technology. Let’s repeat that one again. Technology is when you play with the genes of a crucial staple crop like wheat. Science is when you discover, maybe 25 years later, that it has had knock-on effects in the food chain. Oh dear. Too late for remorse – the genetically modified genome is now globally distributed.

The presenter of the programme, Chris Collins, didn’t even spot the cognitive dissonance of his own script. In the first part of the programme he talks about common weeds that are foreign invaders in the UK and cause untold trouble. In the second part of the programme he doesn’t even blink when he talks about modifying crops at the genetic level – not questioning that introducing foreign genes into vital crops might have detrimental, unforeseen impacts – rather like a microscopic version of the imported “plant pariahs”, Buddleia davidii, Rhododendron ponticum and Japanese knotweed. Oh yes, Oxford Ragwort, another introduction to the UK, is not such a hazard, but you can’t guarantee what happens when you get plant invaders.

I find it astonishing that such obvious propaganda on behalf of corporate plans to modify crops for their own private market profit is allowed into BBC television programming.

Climate Change is being used as the Trojan Horse rationale in which to bring GM crops to the UK, and elsewhere, as part of international agricultural development programmes. This is the ideological equivalent of a rogue gene inserted into the DNA of science. I find this an outrage.

I recommend you check the work of GM Freeze to counter this braintwisting manipulation.

And if you want a little bit more of an insider on what Dr Alison Smith, featured in the BBC show, is actually doing with her amazing knowledge of plants – it seems her work encompasses improving the production of alcoholic beverages, not feeding the world. I kid you not :-

https://www.foodsecurity.ac.uk/news-events/news/2011/110615-pr-improved-crops-food-security.html
“Glucosidase inhibitors: new approaches to malting efficiency : Alison Smith, John Innes Centre : Improving the efficiency with which barley grain is converted into beer and whisky would reduce waste and energy consumption in the brewing industry, as well as ensuring profitability. This project aims to improve the efficiency of malting, the first stage in beer and whisky production, by building on new discoveries about how barley grains convert starch to sugars when they germinate.”

What is the BBSRC ? This is a research programme that’s “infested” with corporate people – whose agenda is money-making, not philanthropy.

And what’s genetic modification of crops got to do with Mark Lynas ? Well, just read his new book, “The God Species“, and you’ll find out.

The plain fact in my view is that we do not need genetically modified crops in Europe. In Africa, they’re too poor to afford the chemicals to use with the GM seeds. And in the not-too-distant future, the price of the chemicals will shoot up because of Peak Oil and Peak Natural Gas, making GM crops inaccessible to those North Americans who currently use it. So this particular technology takes us nowhere forward at all. We need to manage water and the root causes of poverty rather than tamper with genes.


https://www.bbc.co.uk/iplayer/episode/b01224kv/hd/The_Wonder_of_Weeds/

BBC 4 TV
Saturday 25 June 2011

“The Wonder of Weeds”

“Travelling around the UK and meeting experts in botanical history, genetics, pharmaceuticals and wild food, Chris Collins tells the story behind the plants most people call weeds.”

45 minutes 20 seconds

…And the massive irony of all this is that the very crop that has become a monoculture at the expense of weeds, wheat, was once a weed itself…

Plant scientist Professor Nick Harberd of Oxford University has researched the moment a weed became wheat.

Nick : “About half a million years ago, there was spontaneously, in the wild, nothing to do with human beings, a cross-hybridisation, a cross-pollination if you like, between two wild grass species…”

“…So one can imagine that humans were cultivating this wheat [10,000 to 12,000 years ago] in a field and then by chance a weed was growing within that field. And there was again a spontaneous hydridisation event beteen the cultivated wheat and this wild grass that was growing in that imaginary field.”

“The whole process made a plant that was bigger and more vigorous. And as a result of this we ended up with the wheat crop we all grow and feed off today.”

Nick can exactly recreate exactly how wheat and weeds crossbred in a lab today…

47 minutes 40 seconds

Weeds helped us out millenia ago and now scientists in the 21st Century have turned to weeds once again for one of the most important discoveries in plant biology ever.

It could save lives by creating a super wheat.

It all took place here, at the John Innes Institute in Norwich.

Alison : “So come on in Chris. You need to sterilise your feet here…”

Chris : “So this means we’re not bringing in anything nasty from outside…”

Alison : “That’s right. No thrips or viruses or anything else that might come in.”

Dr Alison Smith is head of Metabolic Biology here.

Chris : “This is the first time I’ve ever dressed up to go and see a weed.”

Alison : “We look after our weeds very carefully here.”

Alison’s team have been studying a small common weed called Arabidopsis [thaliana] or Thale Cress, which is now used as the model to map the DNA of all plants on the planet.

Alison : “Well this weed is incredibly easy for us to work on. And all plant scientists almost in the world take information from this weed. And many plant scientists only work on this little weed.”

“The reason why it’s really useful is that like a lot of weeds it goes from seed to seed really quickly, so we can get through lots and lots of generations, and that makes it easy for us to do genetic studies to understand how the weed behaves and what all of its genes are doing.”

“But also, about 20 years ago, plant scientists got together. And at that time they were working on lots and lots of different plants. And they decided, let’s work on one plant together that can become the model from which we can develop our understanding of plants.”

“So about the same time as we were sequencing the human genome, we started to sequence the genome of this little weed. So in 2000 we got the entire gene sequence of this weed, all of the genes are known, the same time as we understood the human genome.”

Chris : “So really then, this small weed is a blueprint for all plants ?”

Alison : “This is the model for all plant life, that’s right.”

But the sequencing of the Arabidopsis genome is not just for the sake of it. Alison and her 600 colleagues are unlocking the secrets of the plant’s success, like its speedy growth rate and its hardiness, and are transfering those abilities to the crops that matter to us, like wheat.

This is one of the most important discoveries in plant biology ever, where one of the humblest weeds could save millions of lives around the world.

Chris : “Now we’ve seen our magic weed and you’ve got this genetic blueprint. How do you take that blueprint and apply it to arable crops like this wheat ?”

Alison : “Well we can start to tackle, using this blueprint, some of the real problems that we have with our crops like disease, for example. Our crops are quite susceptible to some diseases. We’ve been able to breed for that, but we haven’t known what genes we’re breeding for.”

“In Arabidopsis, Arabidopsis gets diseases as well, we can understand exactly how it’s resistant to those diseases. We know what genes it needs. And we can say right, where are those genes in wheat ? Can we make sure that our new wheats have the genes that make them resistant to disease ?”

“Another example would be how the wheat exactly makes its seeds. Obviously, this is the really important bit of wheat. This is what we eat. This is human food. We understand a bit about the process of about how these little seeds are formed, but in Arabidopsis we understand in absolute molecular detail how those seeds are made, and that helps us to understand how we make to make better seeds, bigger seeds, more nutritious seeds in wheat. We can apply that knowlege in wheat.”

Well, I know scientists don’t like to be too dramatic, but I’m going to be, because of simply what I’ve found out. Weeds can play a big role in arable crops like wheat, or even maybe the future of humanity.

Alison : “I think it was the starting point for what has to be a revolution in our crops, a revolution in understanding how they work and making them work better and doing that fast.”

“It’s taken our ancestors, you know, millenia, to get to this point. We can’t afford to take the next step in millenia. We have to take it in tens of years or less. And in order to do that, you’re absolutely right, the information from Arabidopsis has been the key to pushing us forward.”

It’s the resilience of weeds and the insights they give us into helping crops survive that makes them amongst the most useful plants on the planet…

Categories
Bad Science Bait & Switch Climate Change Corporate Pressure Divide & Rule Energy Change Energy Insecurity Energy Revival Engineering Marvel Fossilised Fuels Freak Science Genetic Modification Genetic Muddyfixation Green Investment Hydrocarbon Hegemony Major Shift Mass Propaganda Media Non-Science Nuclear Nuisance Nuclear Shambles Oil Change Optimistic Generation Peak Emissions Peak Energy Policy Warfare Political Nightmare Protest & Survive Realistic Models Renewable Resource Science Rules Scientific Fallacy Technofix Technological Fallacy Technological Sideshow Technomess The Data The War on Error Unqualified Opinion

Mark Lynas : Mutant Ninja

Mark Lynas may call himself a “green”, and be a clean-shaven, respectable, politely-spoken Oxford academic type but he appears to be mutating into something very unappealing indeed. He’s written some good books on climate change – every schoolroom and university module should have one – but on energy, he is deep in the political woods, without even a wind-up flashlight.

His latest stunt is to join in with accusations from Steve McIntyre of Climate Audit that the IPCC’s report on Renewable Energy has been partly crafted by people without appropriate independence or expertise. Here, from Andrew Revkin :-

https://dotearth.blogs.nytimes.com/2011/06/15/a-deeper-look-at-an-energy-analysis-raises-big-questions/

“The IPCC must urgently review its policies for hiring lead authors – and I would have thought that not only should biased ‘grey literature’ be rejected, but campaigners from NGOs should not be allowed to join the lead author group and thereby review their own work.”

And who is this nefarious untalented Non-Governmental Organisation ? Greenpeace, it appears, according to Mark Lynas, is not capable of writing about the future of energy (or even the current situation).

Daniel Kammen has weighed in and The Revkin has updated his post :-

“There is no Himalaya-gate here at all. While there are some issues with individual chapters, there is no ‘Greenpeace Scenario.’ The 77% carbon free by 2050 is actually more conservative than some cases. The European Climate Foundation, for example has a 100% carbon neutral scenario and Price Waterhouse has a very low carbon one for North Africa. Further, while the IPCC works from published cases, the scenarios are evaluated and assessed by a team.”

There have been a number of reports written in the last year that back the viability of Renewable Energy technologies in replacing the world’s fossil fuel and nuclear energy systems. Not all of them were crafted by Greenpeace researchers. In fact, virtually none of them. Nuclear…yes…maybe it’s that little word “nuclear” that’s the root cause of Mark Lynas’ problem with Greenpeace.

In the Guardian, he is quoted as saying :-

https://www.guardian.co.uk/environment/blog/2011/jun/15/italy-nuclear-referendum
https://www.guardian.co.uk/environment/2011/jun/13/greenpeace-foe-charles-secrett-criticism

“Many ‘green’ campaigns, like those against nuclear power and GM crops, are not actually scientifically defensible…”

And that’s where you are so wrong, Mark Lynas with the book coming out soon that you seem so desperate to publicise by saying things you know people will find annoying. Nuclear power is a TECHNOLOGY, not a SCIENCE. This is the same basic category error made by Dick Taverne and a number of other public commentators who don’t appear to have an engineering background.

TECHNOLOGY is where people decide that their designs to make something look like they’ll work, build them and don’t foresee flaws with them. SCIENCE is where people study the technology that they’ve built and research the flaws that appear and report on them. Science is what has shown the limitations with the original boasts about genetically modified crops. It turns out that GMOs are a ruse to sell chemicals. And on nuclear fission – the science is in and on the front of your daily newspaper : nuclear power plants pose a number of risks. The advice of the reputable scientists and engineers – old fission nuclear power plants should be withdrawn.

But returning to Renewable Energy, a number of organisations now believe that the demise of fossil fuels needn’t stop humanity from accessing abundant energy. Here is just a very short compilation :-

The Two Marks : Mark A. Delucchi and Mark Z. Jacobson :-
https://www.peopleandplace.net/on_the_wire/2011/2/5/mark_jacobson_and_mark_delucchi_wind_water_and_solar

PriceWaterhouseCooper :-
https://www.pwc.co.uk/eng/publications/100_percent_renewable_electricity.html

CAT Zero Carbon Britain 2030 :-
https://www.zerocarbonbritain.com/

Roadmap 2050 :-
https://www.roadmap2050.eu/

European Renewable Energy Council R[e]volution :-
https://www.erec.org/media/publications/energy-revolution-2010.html

But oh, no, we can’t quote the last one because Greenpeace researchers were involved, and Mark Lynas wouldn’t approve of that. Mark Lynas appears to be living in a world where Greenpeace people can’t have engineering research skills because they have ideals, working for a world that uses safe, clean energy.

The IPCC report on Renewable Energy is here :-
https://srren.ipcc-wg3.de/

Much as I respect turtles, I have to say it – Mark Lynas, you’re a turtle – slow-moving and easy to catch out and turn into soup. You should know by now not to get sucked in by spurious non-arguments from Steve McIntyre. The “cleantech” industry that’s ramping up to provide the world with green energy is worth billions, soon to be trillions of dollars worldwide, and this fact appears to have completely passed you by. The only future for energy is sustainable, renewable, non-nuclear, clean, quiet and safe. There is no other viable, liveable, option.

[ UPDATE : In the Independent newspaper, Mark Lynas is quoted as remarking “Campaigners should not be employed as lead authors in IPCC reports”. So, Mark, it’s really fine for employees of the major oil, gas and mining companies to take a leading role on major IPCC reports; but it’s not fine, according to you, that somebody working for much less money and much higher principles than mere corporate profit should contribute ? Denigrating somebody for being a “campaigner” is a stereotypical insult. Everybody’s got an agenda, campaigners included. What’s your agenda, Mark ? Selling your new book ? Don’t be dismissive about Greenpeace researchers. They may have ideals, but they’re not naive – they also have brains – and with their declared position on getting at the truth they can be trusted to be direct, decent and honest. Where’s your ethical compass, Mark ? ]

Viva Italia !

Categories
Bad Science Science Rules Scientific Fallacy Technological Fallacy The Data The War on Error

Retour au Latour

In the realm of conspiracy theories, one branch is particularly difficult to unseat – suppositions of technological risks to health – or what I am naming “technocankery”, since a good number of them attribute cancer to the use of technology. Why, it is clear to see : cancer is caused by small, unseen mutations, and it’s hard to pinpoint causal effects. “Carcinogen” is therefore a useful accusation to hurl at any technology you don’t like, even if you have no proof or evidence.

But we’re doing science. How we know what we know is through a long chain of experimentation and monitoring, data gathering that can lead to reasonable claims that can then be subject to further testing and assessing. People rightly assert that we need to keep our minds open to possibilities unconceived, or mistakes unknowingly trodden. As the Dalai Lama Tweeted 25th May 2011 : “To arrive at certainty, you need to start from a skeptical posture. The best scientists are impartial, not swayed by their own beliefs.”

Categories
Climate Change Disturbing Trends Energy Insecurity Global Warming Green Power Low Carbon Life Methane Management Peak Emissions Regulatory Ultimatum Renewable Gas Renewable Resource Science Rules Solution City

Renewable Gas #2 : Fugitive urban emissions

Carbon dioxide is not the only greenhouse gas, although it’s the one most scientists worry about on the long term scale. Its diversion out of deep storage into the active global carbon cycle is causing global warming, and that, the evidence strongly shows, is causing widespread and disruptive climate change.

But in short timeframes, methane is the gas on everybody’s worried lips. The sources of methane are affected by global warming, and methane emissions cause strong global warming in the short term, so it’s a positively augmenting feedback, self-amplifying, and causing grave concern in many environmental policy seminars.

People often point the finger at the digestive systems of ruminant livestock when they want to pinpoint a scapegoat for rising methane emissions, but they should perhaps look closer to their own bathrooms and kitchens and their underfloor gas pipelines.

Categories
Global Warming Science Rules

Is this the return of El Nino ?

Click here for the Weekly ENSO advisory.

It seems possible that the Pacific is returning to neutral El Nino conditions, or possibly a full-blown El Nino. If total solar irradiance is increasing due to a renewed sun cycle, an emerging El Nino this Northern Hemisphere summer could make for scorching temperatures.

To add to the aggravation, the Earth’s energy imbalance is leading to higher surface temperatures still, despite ocean cycling of heat to the depths and atmospheric aerosol effects on radiation equilibrium.

James Hansen of NASA and his colleagues are arguing for better measurements of the effect that airborne particulates are having, and sounding the warning siren yet again about Global Warming and the time delay between increased radiative forcing and increased surface warming.

The globe is warming. It hasn’t stopped, and it isn’t getting any cooler. As time goes by, the science becomes ever more verified :-

https://www.columbia.edu/~jeh1/mailings/2011/20110415_EnergyImbalancePaper.pdf

https://www.columbia.edu/~jeh1/

Categories
Cost Effective Direction of Travel Energy Change Energy Revival Engineering Marvel Feel Gooder Freak Science Green Power Major Shift Money Sings Renewable Resource Science Rules Solar Sunrise

Sunshine power

Solar photovoltaic cells based on semiconductor transistor junctions are becoming cheaper, more efficient and more widely relied upon. Mankind can thrive, drinking in the sunshine.

Yet, the solar power technology of today could still become a minor footnote if there is a revolution in Physics or Chemistry :-

https://socialbarrel.com/solar-power-discovery-dims-future-of-photovoltaic-cells/6382/

“Solar Power Discovery Dims Future of Photovoltaic Cells : Posted by Francis Rey on April 18, 2011 : University of Michigan researchers made a breakthrough discovery on the behavior of light, which could alter solar technology from now on. Professor Stephen Rand, Departments of Electrical Engineering and Computer Science, Physics and Applied Physics, and William Fisher, an Applied Physics doctoral student, found out that light, when traveling [sic] through a nonconductive material, such as glass, at the right intensity can produce magnetic fields 100 million times stronger than previously deemed possible. During these conditions, the magnetic field has enough strength to equal a strong electric effect, producing an “optical battery” that leads to “a new kind of solar cell without semiconductors and without absorption to produce charge separation”, Rand said…”

https://detroit.cbslocal.com/2011/04/13/um-says-solar-power-without-solar-cells-is-possible/

https://solar.calfinder.com/blog/solar-research/harnessing-solar-power-without-cells/

Mmm, love that solar radiation !

Categories
Bad Science Emissions Impossible Science Rules Scientific Fallacy The Data

Netting It

Christopher Booker and James Delingpole made common cause this weekend in opposition to the BBC 2 Horizon documentary “Science under Attack” that featured Paul Nurse :-

https://blogs.telegraph.co.uk/news/jamesdelingpole/100074031/sir-paul-nurses-big-boo-boo/

https://www.telegraph.co.uk/comment/columnists/christopherbooker/8290469/How-BBC-warmists-abuse-the-science.html#dsq-content

The Daily Telegraph commentators appear not to understand the Global Carbon Cycle, and how this has been disturbed by mankind’s activities – principally burning fossil fuels and cutting down trees.

There is ongoing exchange between the soil and the air and the plants and the air, and the seas and the air, and so on; but the key Carbon Dioxide fact is that it is building up in the sky.

It’s not the gross figures that count, it’s the net.

The net is the amount that gets left in the air when all the absorption and emissions processes from the Carbon Sinks and the Carbon Sources have nearly cancelled each other out :-

In the Horizon programme the observation is made that mankind’s Carbon Dioxide emission production comes to around 7 gigatonnes a year. By contrast, volcanoes “popping off” and the oceans contribute only about 1 gigatonne – obviously, that’s net, not gross.

The amount of Carbon Dioxide exchanged in both directions between air and seas is much larger :-

Booker claims that the programme was a “misrepresentation”. Delingpole claims that Paul Nurse has demonstrated “really basic, idiot’s-level mistakes about “climate science””.

Amusingly for me, neither of them appear to suspect they could be barking up the wrong creek with the wrong paddle.

Categories
Bad Science Conflict of Interest Corporate Pressure Genetic Modification Genetic Muddyfixation Science Rules Scientific Fallacy Technofix Technological Fallacy Technological Sideshow

Work with me, James Delingpole

To: James Delingpole
Date: 25th January 2011
Subject: Dodgy science on the telly

Dear James,

Like you, I felt somewhat intellectually “tampered with” by Paul Nurse (“Science under Attack”, Horizon BBC 2, 24th January 2011), and I wondered if we should make some sort of common cause against the domination of faulty thinking of the scientific elite in the media.

As you know, I’m a fan of Climate Change Science, and everything I see, read and hear confirms the projections. In the end, you will come to believe, but the evidence for manmade Global Warming is not the source of my contention with the BBC today.

I disliked the incredibly scornful tone of the Genetically Modified research technologist, who when interviewed avoided the broader picture of the imposition of GM crops against the will of the people. He asked a question something like “…if GM crops are so bad, then why have millions of American farmers planted them ?…” and naturally, because you are a smart chap, you and I both know the real answer to that question.

It’s not the quality of the products that keep farmers hooked on GM, it’s the power of the sales force and the exclusivity contracts people sign up to. What people are really buying is not the GM seed but the herbicides, and Paul Nurse didn’t even touch on that subject (but if he had, he might have “interfered with” that, too).

Why is it that Paul Nurse could not distinguish between technology and science ? What blinkered him from separating the brute force of invention from the laboured acquisition of rigorous knowledge ?

Several top science advisers and commentators have made this mistake in the past, including John Beddington and Dick Taverne :-

https://www.telegraph.co.uk/earth/agriculture/geneticmodification/8278241/GM-food-what-are-the-rules.html

https://www.whale.to/a/lord_dick_taverne.html

So, James, can we stand shoulder-to-shoulder on opposing untested technologies ? Can we walk together under the same banner, protesting Frankenstein biofuels and gene poisoning ?

Can we find something to agree on, something to work together for ?

With my finest regards,

Jo Abbess

Categories
Global Warming Science Rules The Data

Revealing the Global Warming Signal

Revealing the Global Warming Signal
Jo Abbess
06 January 2011


1. The statistical meaninglessness of the global average temperature

Analysis of datasets of Earth surface temperatures from instrumental records and reconstructions from proxies should take into account vital metadata, measured knowledge about cyclic influences, annotations of overall climatic regimes and unique short-term events, that can enable informed analysis. “The climate system…has multiple components with physically distinct characteristics…basic physical considerations argue strongly against the notion that the global average surface temperature has a single characteristic time scale, or time constant.” (Foster et al., 2008). Discussion of uncontextualised curves can be counter-productive (BBC, 2010), as the appliance of inferential statistics and other numerical techniques has been contested as inappropriate (Kelly and Jones, 1996; Mann et al. 1998; Rahmstorf, 2006; von Storch et al., 2004, Wahl et al. 2006), given that variables forcing the thermal response of the climate cannot be assumed to behave in a Gaussian probabilistic fashion, be unmodulating over time, be independent of each other or be guaranteed to have linear effects. Much is now known about internal cyclic variability, and unrepeatable influences such as random volcanicity, the time parabola of industrial aerosol ejection, major fire seasons and the profiles of short-lived “climate shift” re-organisations (Miller et al., 1994), so it can be claimed that the climate system is no longer a black box, and should not be mathematically treated as such. A reasonable axiomatic assertion can be made that the rapid accumulation of greenhouse gases in the atmosphere is causing a regular time-varying response, but that this can only be revealed by systematically deducting the impact of other well-studied signals. As the climate system is composed of ongoing and random events, and suffers episodes of localised non-linearity, with suggestions of chaotic bifurcation thresholds and hints of multiple stable states, this is not facile. The development of a standardised “resolved” global temperature dataset with less noise would be a useful communication tool. Published and tracked over time, it could give a clear visual signal of whether the thermal response is departing from the projected pathway – a useful policy tool. The detection and attribution of global warming using datasets of real world observations that are filtered for known effects is a valuable exercise that corroborates modelling of the radiative forcing on the climate system. One representative study of this kind has resolved the underlying global warming trend as continuously and consistently rising. “Global-mean surface temperature is affected by both natural variability and anthropogenic forcing…identifying and removing from global-mean temperatures the signatures of natural climate variability over the period January 1900 [to] March 2009…filtered from the record, the residual time series reveals a nearly monotonic global warming pattern since [about] 1950.” (Thompson et al., 2009).

As part of a fully comprehensive method, in order to be confident that millenial-, age- or even epoch-scale changes are not influencing current temperature evolution, it is first necessary to consider our place in geological time by summarising the outcomes of paleoclimatological research. Then, it is necessary to consider all the lines of evidence that parametrise modern era climatic influences, developing indices (indexes) of their magnitude and duration, enabling their effects to be deducted from the total at all points, to reveal the underlying global warming signal. It is also necessary to isolate and remove errors in instrumentation, which may result from changes in instrument choice or method, or bias owing to the distribution of measurements, or other features of data collection. Only when the residual anomalies are revealed is it appropriate to discuss statistical analysis of the radiative forcing of global temperatures.


2. Our place in geological time

2.1 The 6 billion year time scale

This time period includes the accretion of the Earth. The carbon dioxide concentration in the Earth’s early atmosphere was very high, and this was only significantly reduced and replaced with atmospheric oxygen when life forms emerged that respired oxygen, and minerals became oxygen-saturated, starting some time after 2.5 billion years ago (Anbar et al., 2007; Bolin et al., 1979). Evidence suggesting the sequestration of carbon dioxide by the “biological pump” and weathering can be seen in the “descending stairway” glacial periods of the Vostok ice core record of the last 800,000 years (Jouzel et al., 2007). Aside from periodic interglacials, major volcanism and extinction events (Ward, 2006), the tendency has been towards less carbon dioxide in the atmosphere, and less greenhouse effect on global temperatures.

Current trend of surface temperatures on this timescale : gradual cooling.
2.2 The 500 million year timescale (Phanerozoic)

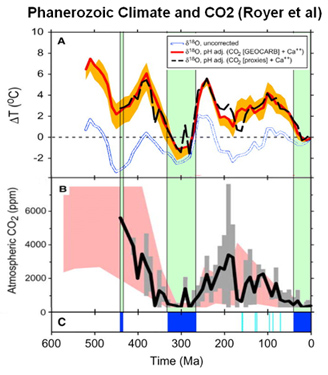
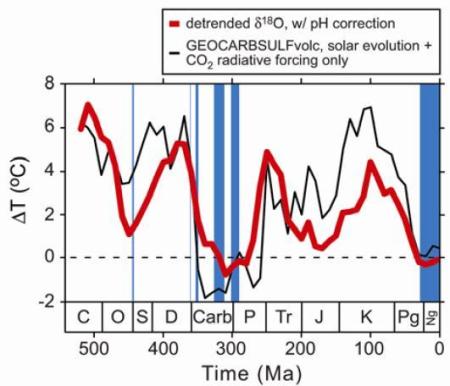
The GEOCARB III project and other research into deep time proxies from the emergence of multicellular life, show that over the last 500 million years the Earth has cycled between an “ice house” and a “greenhouse”, and that we are currently experiencing the low point of a Great Ice Age, with significant glaciation of the polar regions (Royer et al., 2004). Evidence from the previous cold state, the “Permo-Carboniferous”, which had a similar continental layout on the Earth’s surface as today, and could be analogous, shows continued glaciation for around 50 million years. The current Quaternary “ice house” has been running for less than 50 million years and so could be expected to continue.

Current trend of surface temperatures on this timescale : overall cooling since around 250 million years ago (Royer et al., 2004, Figure 4), and currently stable in the low temperature range.

2.3 The 65 million year timescale

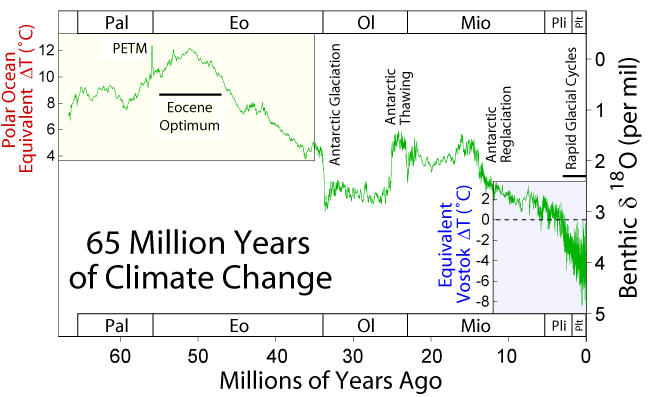
The permanent glaciation of Antarctica occurred around 34 million years ago (DeConto and Pollard, 2003, Figure 2c). Commencement of episodic glaciation of the Northern Hemisphere is thought to have been possible since around 25 million years ago (DeConto et al., 2008), and extensive glaciation of the North Pole region occurred around 3 million years ago (Lunt et al., 2008). There is evidence of several major spikes and optima in temperature including the Palaeocene–Eocene Thermal Maximum (PETM) at 55 million years ago (Bloom, 2010; Zachos et al. 2008 Figure 2). These have been attributed to various external forcings such as large volcanic or mantle plume emissions of carbon dioxide and methane from the Earth’s interior, or changes in the deep ocean currents or sea level, causing the sudden release of methane from subsea hydrate provinces (Davy et al., 2010; Bice and Marotzke, 2002). Overall, however, the general trend has been a reduction in temperatures.

Current trend of surface temperatures on this timescale : generally falling.

2.4 The 5 million year timescale

This timescale features climate cycles that change in phase from shorter to longer over the period (Lisiecki and Raymo, 2005, Figure 4, LR04 oxygen 18 isotope proxy for average global ocean temperature). Whilst the most recent cycle peaks are roughly as warm as those at the start of the period, the cycle troughs are cooler. There was near monotonic cooling of the envelope over this timeframe, not perturbed by the onset of permanent Northern Hemisphere glaciation.

Current trend of surface temperatures in this timescale : cooling.

2.5 The 1 million year timescale

Ice cores range back to around 800,000 years, revealing the onset of 9 interglacials (Luthi et al., 2008, Figure 2). Each interglacial period shows relatively sharp warming over a period of several thousands of years, followed by a slow decline in temperatures over the next tens of thousands of years, until conditions cross a threshold and a glacial period begins. Each glacial period is punctuated by multiple relatively rapid and short-lived warmings (interstadials), which are thought to portray roughly 1,470 year cycles of Dansgaard-Oeschger events in Bond cycles, interspersed with Heinrich events (Alley, 2000b, Figure 12.4; Bond and Lotti, 1995; Bond et al., 1997; Bond et al., 2001; Debret et al., 2007; Fluckiger et al, 2006; McInnes, 2008).

The last glacial period began around 116,000 years ago, and terminated around 11,000 to 12,000 years ago, and had around 25 Dansgaard-Oeschger cycles in that period (NGRIP, 2004, Figure 4). The current interglacial, which began roughly 12,000 years ago appears to be more uniform than previous interglacial periods, and has shown a gradual decline in overall temperatures, as do previous interglacial periods.

Current trend of surface temperatures in this timescale : cooling.

2.6 The 20,000 year timescale

The Earth’s climate experienced its Last Glacial Maximum at around 20,000 years ago, with deglaciation tracking the solar forcing (Clark et al., 2009) into the cooler Older Dryas period (that included Heinrich Event H1) starting 18,000 years ago (Shakun and Carlson, 2010). Bolling-Allerod warming starting around 14,500 years ago (Liu et al., 2009), followed by the sharp Northern Hemisphere-focussed cooling of the Younger Dryas period at 12,900 years ago (Broecker, 2006; Murton et al., 2010), and a sharp warming again at around 11,700 years ago (Steffensen et al. 2008, Figure 2), the Termination 1 that heralded the Holocene era. This start to the current interglacial has been compared to Termination 5 which had a similar start-stop-start (“AMOC hysterisis” – Liu et al., 2009) behaviour (Marine Isotope Stage 11 (MIS 11)).

Since the start of the current interglacial period beginning at Termination 1, there have been several cooler periods (stadials), including what is termed the 8.2 kiloyear event (Carlson et al., 2009). The current interglacial period has been characterised by several periods of slightly warmer temperatures, at both millenial and centennial scales, but for the past 6,000 years, temperatures have generally been on the decline. The current interglacial period is expected to last for some time longer – 50,000 years (Berger and Loutre, 2002).

Current trend of surface temperatures in this timescale : cooling.
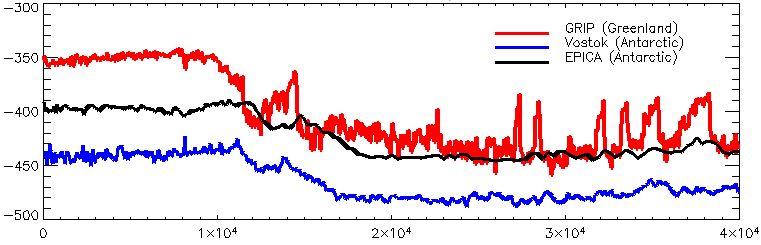
2.7 The last 8,000 years

Within the 8,000 year timescale, there were several significant cooling and warming events identifiable in the Arctic region of the of Late Holocene, under an overall cooling arc, according to data available from the Greenland Ice Sheet Project (GISP 2) (Figure 1). Since approximately 3,500 years BP but prior to the 20th Century, there were four warmer than average centennial-scale periods, with successively lower peaks (Figure 2). Over the 8,000 year timeframe there were approximately 10 cooling-warming cycles, with most periodicities between 500 and 800 years (Kaufman, 2009; Turney, 2005, Figure 5 for one proxy). These are variously considered to be driven by solar cycles (Jiang et al., 2005; Ogurtsov, 2010) or oceanic seesawing (Barker et al., 2009; Maslin et al., 2001; Maslin and Smart, 2009; Seidov et al., 2001; Severinghaus, 2009; Stocker and Johnsen, 2003; Swingedouw et al., 2008). Northern Hemisphere temperatures as a whole do not show the same signature of the Greenland variations in reconstructions (Christiansen and Ljungqvist 2010; Jones and Mann, 2004; Ljungqvist, 2010; Mann et al., 2008, Seppa et al., 2009), and so the underlying causes of Greenland temperature cyclicity cannot be invoked to explain anomalous global warmth in the 20th and 21st Centuries.

Temperatures in Antarctica were more stable, reflecting its climatic isolation, and experienced an overall cooling arc from about 6,000 years BP, having recovered from the 8.2 kiloyear cooling event, which shows a correlate in the Northern Hemisphere record, and can therefore be taken as global in scope. The ice core from EPICA Community at Dronning Maud Land in Antarctica published in 2006 (EDML) shows this clearly (Figure 5), and the EPICA Dome C data also indicates a similar shift (Figure 4). Studies of solar forcing suggest that the cooling trend could continue for another 23,000 years (Imbrie and Imbrie, 1980).

Current trend of surface temperatures on this timescale : cooling.

2.8 The 150 year timeframe

This has been the period of the instrumental record, and has shown rapid warming consistently throughout, which appears to be unprecedented. Although there is evidence of abrupt climate change in recent millenia, these events appear to have been generally sub-decadal, probably associated with changes in oceanic circulation that seem to cross some threshold (Alley, 2003; Alley, 2007; Bond et al., 1999; Broecker, 1997; Broecker, 1999), concentrated (at commencement) or localised in a particular region (Grachev and Severinghaus, 2004; Kobashi et al., 2008; Murton et al. 2010), and if there was a warming, a cooling generally came first (Steffensen et al., 2008). The last 150 years do not resemble this scenario. There appears to have been a departure from cooling trends at around 1880 (indicators point to a range between 1850 to 1910) AD, and a decadal rate of warming that appears significant on a centennial timescale.

Ocean waters in the Arctic and North Atlantic have recently been freshening (Peterson et al., 2006), but it is uncertain if this threatens a collapse of the North Atlantic Meridional Overturning Circulation (AMOC) (Bryden et al., 2005; Garzoli et al., 2010 Section 5 “Fresh Water Balance”, Holmes et al., 2010, Page 2). It seems that the Atlantic circulation has changed its pattern since the advent of the Holocene era (Negre et al., 2010), so may not be subject to the same kind of abrupt climate changes as previously, although this doesn’t rule out rapid swings in future (Alley et al., 2003; Gregory et al., 2005; Lisiecki et al., 2008).

Temporally microfine “abrupt” salinity and temperature anomaly events in the Arctic relate to the natural internal variation of the Northern Atlantic Oscillation (Golubeva and Platov, 2009; Golubeva, 2010; Sundby and Drinkwater 2007), fresh water-induced, “cropped” quasi-Heinrich surges (Ziegler, 2009, pages 16, 98), which may be able to compensate for some of the land surface global warming anomaly by hemispheric oceanic thermal reorganisation (Thompson et al., 2010, Figure 1 “NH – SH”), “pumping” in phased steps driven by threshold conditions, but this periodic “negative feedback” has not interrupted the overall climb in global temperatures (Hansen et al., 2010).

Current trend of surface temperatures on this timescale : warming.


3. Current climatological influences

The current trend for surface temperatures is warming. The principal theory to explain this is additional Greenhouse Effect from mankind’s activities – the Theory of Anthropogenic Global Warming. The IPCC’s Fourth Assessment Report confirms that the core elements of this theory are robust (IPCC, 2007c, Section TS.6 “Robust findings”). Although the theory has been verified in many respects, there are also clear uncertainties, particularly in the area of the Earth’s transient and equilibrium climate change response. The key question is whether the Earth, in responding to the global warming signal, can re-adjust its climate, via a set of negative (dampening) feedbacks, leading to little or no overall temperature change.

3.1 The Burden of Proof

In order to provide evidence of a causative relationship between mankind’s disturbance of the Global Carbon Cycle and putative global warming, certain things have had to be established :-

3.1.1 That the near surface atmosphere and upper ocean temperatures on Earth have been rising.

3.1.2 That so-called Greenhouse Gases cause the Greenhouse Effect, and that increasing Greenhouse Gas concentrations in the atmosphere can cause added Greenhouse Effect.

3.1.3 That concentrations of Greenhouse Gases in the atmosphere are rising.

3.1.4 That mankind’s activities are responsible for increasing levels of Greenhouse Gases in the atmosphere (“fingerprinting” from detection and attribution studies).

3.1.5 That there are no tertiary factors that could be causing any similar magnitude of observed global warming.

3.1.6 That there are no cyclic internal variations in the Earth system that could account for any similar temporary or sustained magnitude of observed global warming.

3.1.7 That the data are accurate.

3.1.8 That climate change (in response to global warming) is not causing negative feedbacks to counteract global warming.

3.1.9 That changes in the Global Carbon Cycle (in response to global warming) do not counteract global warming.

3.2 The Evidence

3.2.1 Global Warming is happening

Robust findings from the IPCC Fourth Assessment Report Working Group 1 established a consensus on the evidence of global warming (IPCC, 2007c, Section TS6.2.1). More detailed understanding continues to be developed, such as the effect of stratospheric water vapour on tropospheric temperatures (Solomon et al., 2010), the irreversibility of warming because of ocean heat content (Solomon et al., 2009); confirmation of strong and continuing ocean heat content (Domingues et al., 2008; Ishii and Kimoto, 2009; Levitus et al., 2009; Lyman et al., 2010) and the string of warming records being broken in the major data sets (including NASA GISS (including “Warm Stations”), NOAA NCDC, Met Office HadCRUT3, RSS and UAH).

Measures have been taken to address the lack of temperature records and proxy temperature data in the Southern Hemisphere, such as the deployment of the ARGO network of ocean monitoring buoys. However the paucity of Southern Hemisphere data does not significantly alter the conclusion that this half of the Earth’s surface is also warming, in step although not in gradient, with the Northern Hemisphere (NASA GISS, 2010).

Differences between the major temperature records have been potentially ascribed to either the way that data is collectively treated and summarised (gridded) or differences in how temperatures are interpolated in the Arctic region from sparse monitoring. Despite this ongoing discussion, it is clear that all the major sources of data show synchronous regional and overall global warming of similar magnitude.

3.2.2 Greenhouse Gases cause the Greenhouse Effect

That Greenhouse Gases can absorb sunlight and re-radiate infrared (the “warming” part of the electromagnetic spectrum) is science that is roughly 150 old (Arrhenius, 1896). It’s basic Physics. Barring some entirely new postulated quantum effect from a particular species of gas or particulate matter found to form part of the atmosphere, or some previously undiscovered property of the Oceans or the solid matter that forms the Earth’s crust, it can be safely asserted that molecular gases with asymmetrical oscillatory modes are the cause of the Greenhouse Effect, keeping the Earth’s surface warmer by around 30 degrees Celsius (IPCC, 2007e, p. 97) than it would be without an atmosphere; as they have a warming effect on their surroundings in the presence of sunlight, through their behaviour in relation to electromagnetic radiation.

3.2.3 Greenhouse Gas Concentrations rising in the atmosphere

The data work on atmospheric species (NOAA, 2010) confirms unambiguously that concentrations of carbon dioxide and other Greenhouse Gases are rising in the Earth’s atmosphere. Methane concentration growth slowed (IPCC, 2007a, p. 7 (135) ), but since 2007 growth in its atmospheric concentration has restarted (Rigby et al., 2008). The oxidation of methane (Boucher et al. 2009) has likely led to an increase in stratospheric water vapour (IPCC, 2007a, p. 24 (152); Myhre et al., 2007). Ozone levels in the troposphere respond to methane concentrations (Fiore et al., 2008), and have also been rising (IPCC, 2007a, p. 3 (131) ). Modifications to the Montreal Protocol contributed to restraining growth in halocarbons, chemistry with high Global Warming Potential.

3.2.4 Fingerprinting Humankind

In detection and attribution studies, progress has been made in clearly “fingerprinting” humankind’s activities as the cause of rising concentrations of atmospheric Greenhouse Gases. The work on the ratios of carbon isotope species has shown that fossil fuel-derived carbon is increasing in the atmosphere. When fossil fuels are burned, they oxidate, and a clear signal of oxygen depletion in the atmosphere has been detected (IPCC, 2007a, Figure 2.3), which outstrips possible effects from deforestation, or the any mass death of photosynthetic life on land, or in the oceans, due to acidification from increased atmospheric carbon dioxide.

3.2.5 Significant External Forcings

In any empirical research that seeks establish the cause or causes of an effect, it is always necessary to consider tertiary factors to the hypothesis – other possible causes that may better explain the outcome. Also, it is necessary to consider indirect causation – that there is a precursor, a factor that causes the cause being considered.

Some influences on temperature in the Earth system are considered to be “external” to the normal climate cycles, and some as inherent “internal” variation (see further down).

3.2.5.1 Radiative Forcing

As a measure of the warming effect at the Earth’s surface, radiative forcing is more “readily calculable” (IPCC, 2007a, p. 5 (133) ) than overall climate sensitivity. The “forces for warming” arise from the composition of the atmosphere, influences from the chemical species, chemical reactions and airborne particulate matter (aerosols) such as dust and ash (Lohmann et al. 2010). There is discussion about whether some effects should be considered feedbacks or primary forcings (IPCC, 2007a, p. 153). There are also complex discussions about the sign of the influence, whether warming or cooling, at different heights in the atmosphere and various regional locations (Alterskaer et al., 2010). One of thorniest issues appears to be whether the forcings should be calculated in a way that discounts (Alterskjaer, 2010) or accounts (Hansen et al., 2005) for the short-term stratospheric response.

There is much agreement that the rapid increase in carbon dioxide in the atmosphere acts as a pulse, an almost instantaneous (in geological timescales) compositional change in the atmosphere and is modelled as such (IPCC, 2007d). There are still some areas of “low” scientific understanding (IPCC, 2007a, Executive Summary), but aside from studies on clouds, these are for chemistry where influence on warming is anticipated to be minor.

One key area of study is the various effects of industrial aerosols, particulate matter and chemical species produced by humankind’s activities such as burning fossil fuels for transport, electricity generation and manufacturing; which go on to reside and react at various regions and levels of the atmosphere (Hansen et al., 2005, p. 35), with various warming or cooling impacts. An example is the direct aerosol effect, the scattering and absorption of incoming solar electromagnetic radiation by airborne particulate matter. Scattering leads to less sunlight reaching the surface of the Earth, and is the key factor in what has been named “Global Dimming”, an effect that has protected the Earth from some global warming (Ramanathan and Feng, 2009). Dust has apparently been identified as a coolant (Mahowald et al., 2010), or has a mixed effect (Kok, 2010). The differences in the temperature records of the Northern and Southern Hemisphere can be partly explained by such studies.

High levels of aerosol in both the stratosphere and the troposphere are the major factors in the net negative radiative forcing at the surface of the Earth (IPCC, 2007a, p. 132, Executive Summary, p. 208, Section 2.9.5), however, the evidence is that Earth is as a whole still warming (IPCC, 2007b, Sections 3.2, 3.8), perhaps exponentially (IPCC, 2007b, Tables 3.2 and 3.3), which must be attributable to the tropospheric radiative forcings summing to a positive, warming value (IPCC, 2007a, p. 205, Section 2.9.2).

If the atmosphere, and the oceans, with which it interacts, were not in constant motion, and if the climate response didn’t include some additional warming (cooling) as positive (negative) feedback, the radiative forcing calculations could lead to straight-forward projections of global warming, but the real world is more complicated than just considering a simple well-mixed atmosphere in stasis on a non-rotating Earth. However, radiative forcing of atmospheric components, expressed in Watts per square metre, helps tease out the relative strength of various unknowns, such as the correct magnitude and sign of the warming influence of solar irradiance change in various parts of the electromagnetic radiation spectrum (Hansen et al., 2005 paragraph 8; Haigh et al., 2010).

3.2.5.2 Volcanic Eruptions

The Mount Pinatubo volcanic eruption in June 1991 afforded a prime opportunity to study the effects of volcanic aerosols in the atmosphere. The analysis showed an intense, but short-lived (less than 5 years), global cooling effect (IPCC, 2007a, pp. 132, 137, 142, 193). Regular volcanic activity does emit carbon dioxide (and methane too by disruption of sequestrated fossilised organic matter) into the atmosphere from the Earth’s crust (Hards, 2005), but measurements of carbon dioxide levels after eruptions do not show any great rise in atmospheric concentrations (NOAA, 2010). So, recent global warming cannot be attributed to volcanism.

3.2.5.3 Solar Irradiance Change

Obviously, the Sun is the primary cause of keeping the Earth’s surface warm, but the rate of recent rise in Earth’s surface temperature does not correlate significantly with changes in solar irradiance output (Lockwood and Frohlich, 2008). Changes in solar activity are considered to account for a small proportion of measured global warming over the last 100 years, but their contribution to global warming of the past 20 – 50 years is vanishing (Ammann et al., 2007; Duffy et al., 2009; Meehl et al., 2004, Lean, 2010; Lockwood, 2010). Solar side-effects such as the solar wind, and its effects on cosmic rays, and their purported effects on the atmosphere and its clouds have not been shown to have any significant effect (Skeptical Science, 2010). There is strong evidence from paleoclimatology that change in solar insolation due to the precession and tilt of the Earth’s axis, and its orbital progression around the Sun have strongly influenced climate cycles in the deep past (see Section 2). But then, as now, change in solar output and insolation have been cyclic or periodic, with quasi-sinusoidal change, whereas current global warming appears to be exponential and unidirectional. Episodic alterations in the spectral distribution of solar output during its short-term 11-year cycles may play a part in variations of the temperature of the near-surface Earth (Haigh et al., 2010), but again, these would be expected to crest and dip on the whole, whereas current global warming appears to be a sustained positive phase change.

3.2.5.4 Land Use Change

Deforestation is said to account for something in the region of 15% of net anthropogenic Greenhouse Gas emissions to air (van der Werf et al., 2009), and so, although it will have long-term, possibly permanent, effects on Earth’s climate, it cannot account for the bulk of recent warming. Nitrous Oxide is a Greenhouse Gas whose rising emissions are attributable to changes in agriculture (IPCC, 2007a), but it has only roughly a third of the effect of methane (IPCC, 2007a, Fig 2.21). Soil erosion and desiccation from agricultural intensification has led to a breakdown in the carbon cycle – less carbon dioxide is sequestered in soils, but the scale of emissions increase cannot account for the levels of warming being measured.

Widescale deforestation and the development of agriculture have been suggested to explain the extremely unusual and stable nature of the Holocene era (Ruddiman et al., 2010), in that the temperatures have not reduced rapidly after the warming spike at the end of the Last Glacial Maximum as they did in previous glacial Terminations, as seen in the ice core records (see Section 2). Global warming has reversed the general cooling trend of the last 6,000 years in the last 150 years or so, which just happens to coincide with vast increases in agricultural production and the exploitation of timber, aided by the use of fossil fuels for energy; but the fossil fuel emissions are by far the largest factor.

3.2.5.5 Rapid warming – alternative mechanisms

There have been several alternative mechanisms proposed for periods of rapid global warming in Earth history, one of which being the mass emission of carbon dioxide and methane during the collision of tectonic plates, triggering ocean anoxia and emissions of warming hydrogen sulphide and mass extinction (Ward, 2006). While there is evidence of anoxic events taking place currently, these seem to be associated with run-off from agricultural and toxic waste into the oceans. There is no evidence of the “ocean conveyor belt” (Lozier, 2010) undergoing major alterations which could allow explanations of large quantities of heat or methane being released to the atmosphere from ocean depths. Although there is evidence of rising methane concentrations in the atmosphere, and methane emissions are causing concern in the melting permafrost and tundra of the Arctic region, these are considered to be an effect of global warming rather than a cause, unlike ancient events (see Section 2).

The current warming can be attributed with high levels of confidence to radiative forcing. Confirmation comes from a wide variety of sources, for example, consideration of the Diurnal Temperature Range, stratospheric cooling, hemispheric and zonal differences in warming, and analysis of extremes and frequencies of extremes in weather.

3.2.6 Significant Internal Variability

The magnitude of the swings in internal variability in the climate can sometimes overwhelm the signal from global warming. However, variability cannot be equated with a trend. The aim of studies into variation must be to establish whether the changes are a result of global warming, or a cause. Here, the most significant internal variability factors are considered.

3.2.6.1 Oscillations – Climate Cycles

The air pressure oscillations and their climatic teleconnections are a significant feature of the Earth system, and it is important to be clear that recent global warming is not merely an upswing in one or more of these climate cycles. There is evidence of multi-decadal waves patterns, but oscillations would need to have a centennial-scale long cycle, or longer, to explain the current warming period.

When analysing climate oscillations it is important not to be misled by anomalies in the data series, which may be due to unrelated factors, or even instrument errors (see “Data Correction” section below). For example, the cooling phase between the late 1960s and early 1970s has been associated with a “Great Salinity Anomaly” in the North Atlantic – which could have been caused by meltdown in the polar region (Peterson et al., 2006, Figure 4; Thompson et al., 2010). Ongoing changes in Arctic precipitation and ice pack could be responsible for future short-term cooling episodes (Dickson et al., 2000, Figure 7; Miller et al., 2010, p. 21 (1699); NSIDC, 2008; Seo et al., 2010).

There is evidence of change in the climate oscillations as measured by their indices over timescales of decades – the patterns of the anomalies have changed as well as the trends (Hurrell et al, 2003, NCAR, 2010; NOAA Data, 2010). This suggests the climate oscillations are being altered by global warming.

There is an inherent problem in trying to assess the indices of the oscillations, as the “base” period on which the calculations of anomalies in the wave patterns are made may not represent a time of stability, as is suggested by the indices datasets themselves (Hurrell and Deser, 2009; NCAR, 2010). The mean of a moving target may not represent a suitable measure from which to judge movement overall.

The underlying trends for oscillations seen in the 1980s to 1990s have not persisted (Osborn, 2010), so some multi-decadal cyclicity could be a component of what is happening, or other factors may be coming into play, such as one-way-only threshold-reliant readjustment of the vertical layers of the atmosphere, or the transport between ocean basins. The evolution of the ENSO could corroborate this (Ashok et al., 2007).

Transformation arithmetic is used to calculate the “normal” patterns of oscillation in the climate of the ocean basins (Empirical Orthogonal Functions (EOF) or Principal Components Analysis (PCA)), and the reported indices are therefore modulation anomalies from these “carrier” wave patterns. However, if the basic modality of the oscillations are themselves subject to change, the approach breaks down at the first assumption (Kellie-Smith, 2010, 4.5 “Conclusion”). New ways to subtract the ENSO signal from global temperatures are being developed (Chen et al., 2008a, p. 5 “contaminates”, Chen et al. 2008b).

At present there is no contender for an oscillation that correlates either its positive or negative phase index, or both, with the global warming trend. A case in point is the Arctic Oscillation (AO), which showed a positive trend in its index throughout several decades, and suggested a correlation with global warming, but has now gone into a severe negative phase, even as 2010 is expected to be the warmest year in the instrumental record.

Combining the indices of the oscillations does not show a general trend, as they are all, to some extent, co-varying with time lags, which would tend to cancel them out. However, the ENSO oscillation, and polar modes including the North Atlantic Oscillation (NAO) seem to lead or greatly influence the others, and could be considered real internal variation.

3.2.6.2 Circulations

There has been some evidence that the ocean circulation patterns are changing in response to global warming (Sherwood et al., 2011; Williams and Grottoli, 2010). However, although highly variable, the strength of the Atlantic Meridional Overturning Circulation (AMOC) does not appear to be suffering significant reduction (RAPID-WATCH, 2010).

As regards air mass circulation, coincident with unusually low indices in the Arctic Oscillation (AO) in recent years, displacement of the jet streams have been implicated in “blocking” events, preventing the usual waves of propagation of anti-cyclones in the Northern Hemisphere (see “Mixed Layers” section below; WMO, 2010). Impacts cited in the popular press included the severe winter of 2009/2010, the extreme heat in Russia in summer 2010 and catastrophic flooding in Pakistan in the same season (Woollings et al., 2010). The IPCC Fourth Assessment states that blocking is trending in step with global warming, but only in the North Pacific in connection with La Nina (IPCC, 2007b, Section 3.5.4 “Blocking”). Recent events suggest it could become more general.

3.2.6.3 Mixed Layers

There is evidence that the tropopause has changed its height (Santer et al., 2003; Schmidt et al., 2008), most likely as a result of global warming, and clearly has implications for planetary waves at the troposphere-stratosphere boundary, jet streams and the annular modes of oscillation at the poles (IPCC, 2007b, Section 3.5.6).

The mixed layer between the atmosphere and the ocean has been showing the effects of ocean warming (Domingues, 2008), and the intensity of tropical hurricanes and other storms near the Equator has been shown to have increased owing to higher sea surface temperatures (Elsner et al. 2008).

These changes all have implications for the near-Earth surface temperatures, but it is determined that they are feedbacks, not causes.

3.2.7 Data Correction

Problems with global temperature data sets relate to a number of issues, including changes in technology, instrument bias and alteration in human systems of data collection. Anyone attempting to perform statistical modelling of climate systems based on the data sets will need to first iron out the data wrinkles, or else their analysis risks being unsound. One example is that of an apparent abrupt dip in sea surface temperatures in the period between 1940 and 1950, which it turns out can be explained as a data problem (Thompson et al., 2008). By using a simple arithmetic technique of subtracting oscillation anomalies (indices) and other well-known factors from the overall temperature records, it has been shown that the effect can be attributed to more measurements being done with one method than another. Another example of data correction is when Dr John Christy and Dr Roy Spencer famously had to retract claims regarding global warming when it was discovered that there were bias errors in satellite monitoring data, when in fact there are no significant difference between the major data sets when adjusted (Thorne et al., 2010).

3.2.8 Climate Feedbacks

There is ongoing research into cooling (negative) feedbacks in the climate system, and whether they could constrain the warming effect of increased concentrations of atmospheric greenhouse gases. If these effects are temporary, they could only offer a short-term reprieve. There has been much discussion around the “fertilisation effect” of increased atmospheric carbon dioxide, and evidence has been found to support that (Lewis et al., 2009), although this could be overwhelmed by future climate changes, including in rainfall patterns and drought (Dai, 2010).

There is some suggestion that global warming, since it leads to a higher level of water vapour sustainable in the atmosphere, could lead to enhanced cloud cover of forms that show increased cooling albedo – as long as this compensates for their added Greenhouse Effect. There remain considerable uncertainties about the role of clouds under current conditions of sharp global warming (IPCC, 2007c, Section TS6.2.1; IPCC, 2007b, Section 3 3.4).

Most feedbacks are found to be positive (warming), enhancing and amplifying global warming. The sensitivity of the climate – the exact level of the full-term warming response to the changes in atmospheric composition – remains uncertain, but is known to be significant (IPCC, 2007d).

3.2.9 Carbon Cycle Feedbacks and consideration of Paleo-Analogies

Given that Anthropogenic Global Warming, as proposed, would disturb the Global Carbon Cycle, possible responses have been assessed to see if they could counteract the warming by increasing the carbon pump or carbon sink effect.

3.2.9.1 Evidence of current Global Carbon Cycle change

There are uncertainties in how the Carbon Cycle will respond (IPCC, 2007f, Section 7.3; IPCC, 2007d, Section 10.4). There are some indications that the “biological pump” of the ocean that draws carbon dioxide down from the atmosphere may be compromised (Boyce et al., 2010). However, it is also possible that for now, the oceans and land plants (although not the soils, perhaps) are taking up the same fraction of carbon dioxide from the atmosphere as ever, meaning more carbon dioxide poached from the air in total (Knorr, 2009; Sarmiento and Gruber, 2002, Figure 3). These changes are best explained as being caused by global warming. Changes in the slow geological sequestration components of the Carbon Cycle are probably not measurable.

3.2.9.2 Paleo-Analogies

It is instructive to look back into the deep past to try to establish how the Global Carbon Cycle initially adjusted to, and then re-adjusted atmospheric carbon dioxide levels. These include the sharp warming occurred at the boundary of the Paleocene and Eocene geological eras (PETM) (Kopp et al., 2007), the mid-Eocene (Bijl et al., 2010), Termination V, MIS 11 (Bowen, 2010) and the mid-Pliocene (Ravelo et al., 2009). None of the periods so far considered can be a perfect analogy, because unfolding conditions are highly anomalous, including a very high rate of atmospheric carbon dioxide accumulation.

4. Conclusions

Recent global warming is a real effect (Thorne et al., 2010), and the only significant correlating relationship is with anthropogenic alteration of the atmosphere, as none of the alternative hypotheses could provide the magnitude or signature of the changes observed. The net emissions to air of greenhouse gases from anthropogenic sources, the side-effects of which include the ejection of aerosols, are altering the net radiative forcing. Having established confidently this is the reason for sustained and increasing global warming, it becomes justifiable to deduct the effects of internal variability and episodic external forcings such as volcanic eruptions from the temperature record in order to reveal the global warming trend. Correcting for data problems, compensating for volcanic episodes and deducting the indices of the major climate oscillations from the temperature record, the largest instantaneous modulations, vastly improves perception of the underlying warming signal (Thompson et al., 2009, Figure 12).

Further work on quantifying the change in climate oscillations could lead to new indices that could be applied to further smooth out the saw tooth nature of the progression of the temperature sensitivity of the climate. It remains for the climate change research community to collectively agree how the “resolved” datasets should be produced and published, showing the “smoother” baseline global warming pulse for public and policy use.

Figures

Figure 1
GISP2 Greenland Ice Sheet Project 2 Ice Core Data (Alley, 2000a; Alley, 2004; Cuffey and Clow, 1997).

Raw data points with a second order polynomial trend line added by Excel, covering data from approximately 12,000 years before present up until approximately 200 years before present to prevent the inclusion of the anomalously warm recent period. The second order polynomial trend line has been added automatically, merely to indicate the most likely point of temperature maximum but does not represent any precision in calculation.

Figure 2
GISP2 Greenland Ice Sheet Project 2 Ice Core Data (Alley, 2000a; Alley, 2004; Cuffey and Clow, 1997).

Raw data points with a second order polynomial trend line added by Excel, covering data from approximately 10,500 years before present up until approximately 200 years before present to prevent the inclusion of the anomalously warm recent period. The second order polynomial trend line has been added automatically, merely to indicate the most likely point of temperature maximum but does not represent any precision in calculation.

Figure 3
Lake Vostok Ice Core Data (Jouzel et al., 1987; Jouzel et al., 1993; Jouzel et al., 1996; Petit et al., 1999).

Raw data points with a second order polynomial trend line added by Excel, covering data from approximately 13,500 years before present up until approximately 200 years before present to prevent the inclusion of the anomalously warm recent period. The second order polynomial trend line has been added automatically, merely to indicate the most likely point of temperature maximum but does not represent any precision in calculation.

Figure 4
EPICA Community Dome C Ice Core Data (Jouzel et al., 2007).

Raw data points with a second order polynomial trend line added by Excel, covering data from approximately 13,000 years before present up until approximately 200 years before present to prevent the inclusion of the anomalously warm recent period. The second order polynomial trend line has been added automatically, merely to indicate the most likely point of temperature maximum but does not represent any precision in calculation.

Figure 5
EPICA Community Dronning Maud Land Ice Core Data (EPICA Community, 2006).

Raw data points with a second order polynomial trend line added by Excel, covering data from approximately 12,500 years before present up until approximately 200 years before present to prevent the inclusion of the anomalously warm recent period. The second order polynomial trend line has been added automatically, merely to indicate the most likely point of temperature maximum but does not represent any precision in calculation.

Abbreviations
ya = years ago, relative to 1950
BP = Before Present, relative to 1950
IPCC = Intergovernmental Panel on Climate Change
AR4 = IPCC Fourth Assessment Report
WG1 = IPCC Working Group 1

Glossary
LLGHG = Long-Lived Greenhouse Gas
ENSO = El Nino Southern Oscillation

References

Categories
Bad Science Science Rules

On Bees and Compromise

From: Avaaz.org
Subject: Bee Safe

Bees are dying off worldwide and our entire food chain is in peril. Scientists blame toxic pesticides and four European governments have already banned them. If we get the US and the EU to join the ban, other governments across the world could follow, and save bees from extinction. Sign the petition and forward this urgent appeal : https://secure.avaaz.org/en/save_the_bees/?cl=895516794&v=8114
_______________________________________________________

From: RT

Scientific research does NOT fault one group of toxic pesticides as the primary cause of colony collapse. Most recently published research into the demise of US bumblebee species, for example, suggests that the varroa mite may be the primary cause – species that harbour the mite are declining and those which don’t are not. The introduction of the varroa mite has certainly aided the spread of viral disease and, whilst insecticide use further weakens bee colonies, the major voice suggesting insecticides as the primary cause is not science nor beekeepers but environmental groups. The Bumble Bee Conservation Trust (BBCT) has asked Avaaz to change their campaign but Avaaz declines to respond. I commented to Avaaz that many of us agree that reducing agricultural insecticide use, generally, would be of great benefit to biodiversity but falsely blaming insecticide use [for] colony collapse will damage our hopes of identifying the real causes and, perhaps, focus action in the wrong direction. BBCT are concerned that another primary cause is habitat loss. Avaaz have done themselves a great disservice, not so much in backing the wrong campaign, but by not bothering to check what research has indicated and by not answering critics.
_______________________________________________________

From: jo abbess

In reply to RT’s helpful and well-informed message from a few days ago, I must add that it is becoming clear to me that opinions differ about pesticide safety in relation to bees – and that’s scientific opinion, not just “campaigning” opinion. For example :-

https://www.naturalnews.com/030921_EPA_pesticides.html

“Leaked document: EPA knowingly approved bee-killing pesticide : Wednesday, January 05, 2011 by: Ethan A. Huff, staff writer : A Colorado beekeeper recently obtained a leaked document revealing that the U.S. Environmental Protection Agency (EPA) knows a popular crop pesticide is killing off honey bees, but has allowed its continued approval anyway. Despite opposition from its own scientists, EPA officials first gave the a-okay to Bayer CropScience’s toxic pesticide clothianidin in 1993 based on the company’s own flawed safety studies. But now it has been revealed that the EPA knew all along about the dangers of clothianidin and decided to just ignore them…”

So, is there a hidden depth to this issue ? Are the various pathogens and parasites in bee populations the only reason for Colony Collapse Disorder ? Or are there other factors ? Is it that the industrial farming of hives – transporting them around the country (in the USA) is damaging their immune response, or is the combination of monoculture agriculture, pesticides and GM crops compromising bee survival ?
_______________________________________________________

From: BM

Buglife is asking you to please write to your local MP to raise awareness of neonicotinoid pesticides, their effects on pollinators and to ask him/her to encourage Lord Henley to act on the Buglife Asks. Please feel free to use the draft letter below. You can find your MP’s address using the following link https://www.parliament.uk/mps-lords-and-offices/mps/

Dear ……,

RE: UK pollinator declines and neonicotinoid pesticides

I would like to draw to your attention a recently leaked memo from a US government agency the Environment Protection Agency, whose scientists warn that bees and other non-target invertebrates are at risk from a new neonicotinoid pesticide and that tests in the approval process are unable to detect environmental damage.

Neonicotinoids are highly toxic to bees and other non-target insects, the biggest concerns are that, being systemic they end up in the pollen and nectar in the flowers of treated crops, and hence could poison pollinators, and that being persistent they could wash into streams, ponds and rivers and destroy aquatic life…
_______________________________________________________

From: RT

Thanks, Jo, but of all the potential causes that you indicated, currently there is little evidence to indicate GM crops as a primary causal agent. Certainly there is evidence that there have been bee population collapses in the past but none, of which we are aware, that matches the current problem in the scale of it’s extent and damage.

My complaint against the Avaaz campaign is that there is a widespread agreement within the scientific community that is studying CCD that there is probably not a single cause, but many that appear to act together.

As I commented, earlier, reducing the use of pesticides is entirely to be recommended – but we should note the evidence suggesting that banning DDT has lead to a resurgence of malaria [SEE NOTE AT BOTTOM OF PAGE]. However, blaming one cause could lead to the others being ignored and we urgently need to stop CCD. Research has suggested that insecticide residue patterns do not suggest that any one pesticide or group is the primary cause. Some very interesting research that was published last year indicate the Israel acute paralysis virus as commonly found in hives that have experienced CCD. Research into the causes of CCD are taking place in the USA and the UK: in the USA, go to the Mid Atlantic Apiculture Research and Extension Consortium at:
https://agdev.anr.udel.edu/maarec/category/ccd/
In the UK, go the Insect Pollinators Initiative at:
https://www.bbsrc.ac.uk/pollinators/
Also keep an eye on the work of Prof Francis Ratnieks at Sussex University:
https://www.sussex.ac.uk/biology/profile128567.html
_______________________________________________________

From: jo abbess

In response to one of RT’s links to the Biotechnology and Biological Sciences Research Council (BBSRC) […], I’d like to point out a few links to the page he mentions :-

https://www.bbsrc.ac.uk/pollinators/

Peer review panel membership :-

Professor John Coggins – University of Glasgow (Chair)
Dr David Aston – BBKA
Professor Tim Benton – University of Leeds
Dr Peter Campbell – Syngenta
Professor Angela Douglas – Cornell University
Dr Jeff Pettis – USDA
Professor Ingemar Fries – Swedish University of Agricultural Sciences
Dr Jane Hill – The University of York
Professor Graham Medley – The University of Warwick
Professor Stuart Reynolds – University of Bath
Dr Susanna Sansone – EBI
Professor Robert Smith – University of Huddersfield (Retired)
Professor Mark Tatchell – Independent

So what are these organisations known only by acronyms ?

The BBKA – British Beekeeping Association is sponsored by pesticide manufacturers
https://www.independent.co.uk/environment/nature/beekeepers-fume-at-associations-endorsement-of-fatal-insecticides-2182243.html
“…The British Beekeepers’ Association has been selling its logo to four European pesticide producers and is believed to have received about £175,000 in return. The active ingredient chemicals in the four pesticides the beekeepers endorsed are synthetic pyrethroids, which are among the most powerful of modern insect-killers…”

Syngenta – a manufacturer of pesticides and GM crops.

The EBI – who do they work for ? The companies include Bayer and Syngenta – both manufacturers of pesticides and GM crops :-
https://www.ebi.ac.uk/industry/ind-prog-index.html

Interestingly, the USDA bee projects are fairly clear about the role that a certain group of pesticides plays in damaging bees :-
https://www.ars.usda.gov/research/projects/projects.htm?accn_no=416636
“Bee Research…Objective: To investigate the effects of several insecticides, primarily but not exclusively neonicotinoids, on honey bee mortality, foraging behavior, and overwintering success…to study the effects of neonicotinoids, a class of pesticides which disrupts foraging behavior and increases mortality of honey bees.”

So, do we believe that the BBSRC work on bee research is entirely neutral ?

When it’s being funded by companies who make pesticides and the companies that work for companies that make pesticides, I would say we could well be dubious.
______________________________________________________

From: TH

Hi Jo,

I don’t think the Independent article is very fair to the BBKA, I guess that’s journalism for you! The BBKAs official position is reasonably clear:
https://www.britishbee.org.uk/news/statements/bbka-strategic-review-the-plant-protection-industr.shtml

Certainly the BBKAs working with industry (which started a quarter of a century ago) does appear to have been effective in reducing colony losses from the applications of the older classes of insecticide. The four products which were endorsed are, Decis (Bayer, deltamethrin), Contest [Fastac] (BASF, alpha-cypermethrin), Hallmark (Syngenta, lambda-cyhalothrin) and Fury (Belchim, zeta-cypermethrin) which are all synthetic pyrethroids, not the neonics currently under suspicion.

Consequently I don’t think your listing of the BBKA among the bad guys is fair. No organisation is perfect, but broadly speaking the BBKA has been in the business of protecting & defending bees for a very long time. Its also a reasonably democratic organisation, which debates issues like this as they evolve.
______________________________________________________

From PDK

Someone from church has got excited about ‘Climate Week’.
https://www.climateweek.com/about-us/
Does anyone know anything about this? It feels a bit greenwashy to me.
______________________________________________________

From: RT

I was at the [Climate Week] launch and faith groups were well represented. It attempts to be an act of refocussing attention and of bringing together those engaged in positive action. I wonder why you feel that it is “a bit greenwashy”?
______________________________________________________

From: RJ

[The] steering committee had a long discussion about this and decided to purposefully not support [Climate Week]. We felt we couldn’t join up with the likes of RBS and EDF to do anything with any integrity.

On the other hand, where awareness is raised, we should make the most of it and have something to say! I’m thinking of writing my march parish magazine article about climate week and haven’t yet decided what to say!….anyone out there want to have a go?!
______________________________________________________

From: PDK

I worried about the messages on their website – it seemed like patting people on the back for doing very small actions that don’t really make a difference (on the homepage it actually talks about ‘doing your bit’). And I was suspicious about the corporate involvement. There is a huge Tesco logo on the homepage – these are the people promoting the message that if you cut down on plastic bags you can save the planet (the poster outside my local branch actually says this). I’m also inclined to agree with the steering committee about RBS and EDF. Still, they’ve got a good range of organisations backing it. (Eat your heart out, Climate Alliance!). If they can mobilise people good luck to them – maybe it needs that kind of mainstream approach. But I probably won’t be getting involved.
______________________________________________________

From: EP

https://www.independent.co.uk/environment/nature/exclusive-bees-facing-a-poisoned-spring-2189267.html

“Exclusive: Bees facing a poisoned spring : New kind of pesticide, widely used in UK, may be helping to kill off the world’s honeybees : By Michael McCarthy, Environment Editor : Thursday, 20 January 2011 : A new generation of pesticides is making honeybees far more susceptible to disease, even at tiny doses, and may be a clue to the mysterious colony collapse disorder that has devastated bees across the world, the US government’s leading bee researcher has found. Yet the discovery has remained unpublished for nearly two years since it was made by the US Department of Agriculture’s Bee Research Laboratory. The release of such a finding from the American government’s own bee lab would put a major question mark over the use of neonicotinoid insecticides – relatively new compounds which mimic the insect-killing properties of nicotine, and which are increasingly used on crops in the US, Britain and around the world. Bayer, the German chemicals giant which developed the insecticides and makes most of them, insists that they are safe for bees if used properly, but they have already been widely linked to bee mortality. The US findings raise questions about the substance used in the bee lab’s experiment, imidacloprid, which was Bayer’s top-selling insecticide in 2009, earning the company £510m. The worry is that neonicotinoids, which are neurotoxins – that is, they attack the central nervous system – are also “systemic”, meaning they are taken up into every part of the plant which is treated with them, including the pollen and nectar. This means that bees and other pollinating insects can absorb them and carry them back to their hives or nests – even if they are not the insecticide’s target species. In Britain, more than 1.4 million acres were treated with the chemical in 2008, as part of total neonicotinoid use of more than 2.5 million acres – about a quarter of Britain’s arable cropland…”

My letter from MAFF 17.1.1989 “All insecticides by their very nature are active against living organisms and therefore pose a risk to both human health and the environment”

______________________________________________________

From: RT

Earlier this week I was present at the first directors meeting of a new trust that was established to preserve access to the River Thames and to protect its ecology. One of the other founders expressed the hope that we could keep our integrity by avoiding companies and organisations that perform acts that are antithetical to the new trust’s aims. I observed that we can only make change by establishing dialogue with those whom we would seek to change and a majority of those present agreed.

This has been a major problem within the environmental movement, perhaps even more generally within the voluntary sector. I have heard people talk of purity but not of change and that, I believe, is fruitless.

The recent comments on bees and on Climate Week both refer to companies which should be avoided, but how then do we change them? Breaking the windows of RBS offices in Scotland may make some people feel good but it hasn’t changed their policies.

I’m sure that I have mentioned on this list before that I am a member of the Aldersgate Group. This came about, in Aldersgate’s early days, because I was able to introduce a think tank to the group and to provide a small link with the Church of England. I remained one of a small number of individual members and have seen the group grow very considerably in membership and influence.

I should explain that Aldersgate is a company and NGO led environmental lobbying organisation which seeks more and more effective environmental legislation. It’s a slow process: about nine months ago I first raised the issue of biodiversity, in two weeks we will have our first roundtable and a working group will begin to consider what we should say both to companies and to government.

Last week we had one of our receptions, in the House of Commons, and listened to Chris Huhne talking about where the Government hopes to go, following Cancun. He didn’t get an easy ride, neither did some of his colleagues, late last year, at another reception at Bank of America to discuss the Green Investment Bank.

There are two points that I think derive from this, the first is that Governments tend to listen to major companies, the second is that many companies are beginning to take a strong stance on environmental protection.

I have the good fortune of regularly meeting with senior representatives of major companies and I generally, but not always, find a depth of understanding and concern on environmental matters. I also find people who are active Christians and many others who retain respect for the Church.

Over the past four or five years I have got some respect, probably unwarranted, for being a little acerbic when it comes to getting the science right! Aldersgate is now being flooded by requests for membership and we are being careful to impose limits so that no sector is over represented. We require that members sign up to our five principles which commence with: “Our long-term economic success depends on a healthy environment and the sustainable use of natural resources.”
https://www.aldersgategroup.org.uk/home

It’s not perfect but it’s a good start and the way in which the group supported my request for taking up biodiversity is, I believe, evidence of good intent. I asked the Natural History Museum team which headed the UK International Year of Biodiversity to advise us and that has been welcomed by Aldersgate and by the NHM. Greenwash still exists but real changes are being made.

Surely, though, there is another point that is wholly relevant to us, Jesus engaged with sinners, even with members of the Roman army of occupation and the hated tax gatherers. Much of his ire is recorded as being directed at the ‘righteous’, at those who had regard for their visible place in society.

I do not have any great regard for Tesco, EDF or RBS – or, indeed, for pesticide manufacturers – but I will talk to them, if I’m given the opportunity. The next Aldersgate event will be hosted by RBS, they are not members and I will take every opportunity to sign them up. I’m still working on HSBC; their head of climate change is an active Anglican.

I do not point to this involvement with any sense of pride: according to Richard Dawkin it is simply down to coincidence, having made a friend in the Compass think tank executive shortly before discovering Aldersgate. I like to think that it is yet another of the wonderful opportunities that God has given me. The most significant point is that other Aldersgate members have proven to be good, concerned people who also want to make change.
______________________________________________________

From: RS

Perhaps different people need to pursue what is good in different ways. I would not feel able to participate in an environmental initiative which included, for instance, RBS, while RBS is a major funder not only of coal developments but of the mining company Vedanta, which is guilty of criminal and abusive behaviour in India (see https://londonminingnetwork.org/tag/vedanta/ ).

If your involvement in such initiatives enables you to put pressure on them to change, then by all means use the opportunity. It’s not something I could do myself.

The extent to which people enter into discussion with companies is a matter of discussion within London Mining Network, for which I work, and different groups take different stances. When the matter involves the rights of communities in the face of large corporations, I think it is essential that their views be taken into account and that we do not attempt to speak on their behalf without their permission, or pronounce as acceptable projects against which communities are fighting.

Jesus engaged with all sorts of individual people as individual people, and always with respect. He did not necessarily therefore accept as legitimate what the institutions for which they worked were doing.
_______________________________________________________

From: RJ

RT, I think it’s fantastic what you’ve done with aldersgate. It did take a while for [us] to come to the [Climate Week] decision we did – personally I flip-flopped from one to the other! But I came to the conclusion that although I totally agree we need to engage with these “sinners”, we shouldn’t do so at the expense of helping their PR unless we think it is worth it. And it is a matter of keeping ourselves from evil. Jesus ate with sinners, but he didn’t get involved in their tax collecting. It’s a hard one though,
_______________________________________________________

From: BM

I am not sure you can change people, unless they want to change. I remember when trade with China started we were all told it would change the Chinese way of doing things and help human rights. I think the jury is still out on this one.

I do think people pressure is having an effect on big companies, and if this in turn has an effect on politicisations, all the better. (maybe science is having an effect on big companies as well).

Jesus was killed for all those things he did, and, although he has put light in many hearts to change their ways, there are still plenty of people out there who would do the same again.

good luck [to] RT
_______________________________________________________

From: jo abbess

I think that cooperation is vital across all sectors.

However, I do not like having my involvement co-opted for somebody’s profit-making agenda.

If I discuss a matter with somebody from the Government or business, I try to ensure that the dialogue is genuine, and that I am talking to the person rather than the organisation. It is only with true and careful human contact that any progress in understanding and commitment can take place.

My pointing out the corporate involvement of the members of the BBSRC research establishment is to highlight the unfortunate possibility of conflict of interest.

We all know that compromise is possible and ubiquitous. The question is, should we welcome people being in a position where they may be coerced into a compromise position ?

I would rather that the bee research is not conducted by scientists who are employed by the pesticide companies. It could put them in a corner at some point.

Plus, I was unhappy about the police mismanagement of the 1st April 2009 Climate Camp in the financial district in London. Kettling people put pressure on the volatile minority. I left the Climate Camp on that day when I saw that the police people had been beating up protestors, and found out that some rather excited persons had broken windows – their passions probably having been roused by the caging of protesters – called “kettling”.

I am very unhappy about the advertising rewards that companies will get from sponsoring Climate Week – such a cheap way to sharpen their brand image ! They don’t have to actually cut corporate emissions, they can just attach their name to the event.

I’m not denigrating real efforts on behalf of companies who are making real changes – for example the Carbon Disclosure Project, the supply chain PAS2050 initiative, and the work of the Carbon Trust has had and will continue to have a major impact on carbon control.

The central problem is compromise. Not all corporate initiatives have value, and we need to keep companies accountable by a variety of means.

For this reason, I applaud the work of organisations such as the Ecumenical Council on Corporate Responsiblity – a grown up approach to asking for responsible behaviour. This is leagues beyond Climate Week in looking towards genuine, lasting, significant outcomes.

_______________________________________________________

NOTE ON DDT AND THE RESURGENCE OF MALARIA

https://en.wikipedia.org/wiki/DDT

“…WHO’s anti-malaria campaign of the 1950s and 1960s relied heavily on DDT and the results were promising, though temporary. Experts tie the resurgence of malaria to multiple factors, including poor leadership, management and funding of malaria control programs; poverty; civil unrest; and increased irrigation. The evolution of resistance to first-generation drugs (e.g. chloroquine) and to insecticides exacerbated the situation. Resistance was largely fueled by often unrestricted agricultural use. Resistance and the harm both to humans and the environment led many governments to restrict or curtail the use of DDT in vector control as well as agriculture…”

Categories
Global Warming Science Rules

Bob Ward Gets Stroppy

LSE’s Bob Ward has had his fill of Climate Change denial already this year, and it’s not even February yet.

I’m on some mailing list or other, to which he sent a copy of his strop directed at the poorly-equipped Global Warming Policy Foundation :-

______________________________________________________________________

Re: Global Warming Policy Foundation donor funding levels revealed…
From: Bob Ward

I am copying below the text of my e-mail, mentioned in […] Guardian article as a letter, to Benny Peiser and David Whitehouse of the Global Warming Policy Foundation. I have, as yet, not received any reply. Please feel free to pass on the e-mail message to anybody who might be interested.

Here is my message to Peiser and Whitehouse:

______________________________________________________________________

From: Bob Ward
Sent: 13 January 2011 11:13
To: ‘benny.peiser@thegwpf.org’; ‘david.whitehouse@thegwpf.org’
Subject: Inaccurate and misleading information on GWPF website

Dear Dr Peiser and Dr Whitehouse,

I am writing to draw your attention to seriously misleading and inaccurate information about global temperature trends which riddles the website of the Global Warming Policy Foundation.

Your website features a page on ‘2010 – An Unexceptional El Nino [sic] Year’, dated 3 December and apparently written by Dr Whitehouse:
https://www.thegwpf.org/the-observatory/1973-2010-an-unexceptional-el-nino-year.html

This webpage bears a number of significant errors, which I invite you to correct as soon as possible.

It states: “2010 will be remembered for just two warm months, attributable to the El Nino [sic] effect, with the rest of the year being nothing but average, or less than average temperature”. This is entirely false. Here is a link to the monthly HadCRUT3 dataset, compiled by the UK Met Office and the University of East Anglia’s Climatic Research Unit, which provides the global average temperature anomaly compared with the 1961-1990 average:
https://hadobs.metoffice.com/hadcrut3/diagnostics/global/nh+sh/
https://hadobs.metoffice.com/hadcrut3/diagnostics/global/nh+sh/monthly

This shows clearly that every month of 2010 (with the data for December not yet published) has been well above average, and indeed each month of 2010 has been one of the ten warmest on record for that month. As you know, El Niño typically recurs every two to seven years, so it cannot be responsible wholly, or even mostly, for the temperature in 2010 being amongst the highest since records began in the 19th century.

[Your] webpage also states “the UK Met Office estimates the temperature anomaly (with respect to the end of the 19th century) for 2010 so far as 0.756 deg C”. This is also inaccurate. Firstly, the Met Office’s HadCRUT3 database expresses the temperature anomaly relative to the 1961-1990 average (not the “end of the 19th century”). Secondly the anomaly for the first 10 months of the year was 0.499°C, not 0.756ºC.

[Your] webpage then purports to provide a breakdown month by month of global average temperature (presumably based on HadCRUT3). However, this breakdown appears to be based on the CRUTEM3 dataset (to which you provide a link) compiled by the University of East Anglia’s Climatic Research Unit (which you do not acknowledge):
https://www.cru.uea.ac.uk/cru/data/temperature/#datdow
https://www.cru.uea.ac.uk/cru/data/temperature/crutem3gl.txt

It seems that you are unaware that CRUTEM3 provides surface temperature land measurements only i.e. it contains no data about the 65.7% of the Earth’s surface which is covered by ocean. If you compare HadCRUT3 with CRUTEM3 you can see that the magnitude of the monthly anomalies are very different, although both still show that 2010 was an exceptionally warm year.

Your website then compounds these serious errors with another webpage, headed ‘2010: An Even More Unexceptional Year’, dated 8 December and also apparently written by Dr Whitehouse: https://www.thegwpf.org/the-observatory/2006-2010-an-even-more-unexceptional-year.html

It too contains multiple serious errors which I invite you to correct.

This page begins by providing a link to the webpage on ‘2010 – An Unexceptional El Nino [sic] Year’ and describing it as an “analysis of 2010 based on Met Office temperature data”. I do not know whether these persistently inaccurate references to your source is the result of gross sloppiness or a deliberate attempt to avoid giving credit to the University of East Anglia’s Climatic Research Unit.

This webpage purports to compare your analysis of CRUTEM3 with “other global temperature data sets that are more comprehensive”. It then claims to present an analysis “from the UK Met Office”. But your analysis does not match the HadCRUT3 data and, incredibly, this page provides a link to the CRUTEM3 dataset again. It seems that you are thoroughly confused about the differences between the datasets compiled by the Met Office and the University of East Anglia’s Climatic Research Unit.

The webpage then presents a monthly breakdown of the global temperature data compiled by the National Climatic Data Center of the National Oceanic and Atmospheric Administration. However, your analysis contains numerous errors, for instance claiming that May 2010 was cooler than May 1998 when in fact the temperature was statistically tied as the warmest on record, and claiming that June 2010 was cooler than June 1998 when it was in fact warmer and tied with June 2005 for the warmest on record.

The webpage also states that for the NCDC database “it is possible that 2010 will tie with 1998, or possible [sic] exceed it”. This is misleading as it implies that 1998 was the warmest year, when in fact 2005 was according to this record. The webpage then makes the inaccurate statement that if 2010 is warmer than 1998 “it would be due to the warm months March-June due to El Nino [sic] and not the sign of AGW”. In fact, again, as El Niño recurs on average every 2 to 7 years, it cannot be wholly or even mostly responsible for the fact that 2010 tied with 2005 as the warmest year since the NCDC record began in 1880.

The webpage also presents a monthly breakdown of the global temperature data compiled by the NASA Goddard Institute for Space Studies. However, your analysis contains numerous errors, for instance claiming that June 2010 was cooler than June 2006 when it they recorded the same temperatures, and claiming that July 2010 was cooler than May 2003 when in fact it was warmer.

You also claim that the NASA-GISS record showed that the average temperature for the 11 months to the end of November 2010 was lower than for the comparable period in 2007 and 2005. This is also completely wrong, as this period in 2010 was the warmest on record according to NASA-GISS, as this media release makes clear:
https://data.giss.nasa.gov/gistemp/2010november/

Furthermore, the home page of your website features a graph with the title ’21st Century Global Mean Temperature’. As Dr Peiser confirmed in an e-mail to me on 1 December 2009, this graph is supposed to represent the HadCRUT3 dataset. As I have pointed out on many previous occasions, your graph does not correspond to the HadCRUT3 dataset on the Met Office’s website, particularly by wrongly showing 2009 as cooler than both 2006 and 2007:
https://hadobs.metoffice.com/hadcrut3/diagnostics/global/nh+sh/
https://hadobs.metoffice.com/hadcrut3/diagnostics/global/nh+sh/annual

Despite my requests you have so far refused to correct the graph. I expect that you will update your graph when the HadCRUT3 dataset is updated with the figure for 2010. I suggest you also use that as an opportunity to correct the other mistakes in the graph.

In addition, the choice of 2001 as the starting point for your graph, as I am sure you are aware, hides the significant and unequivocal rise in global average temperature that occurred during the 20th century. As you choose to ignore the temperature record prior to 2001, visitors to your website cannot appreciate that 9 of the 10 warmest years on record have all occurred since 2000. Perhaps when you update your graph you could also make it less misleading in this respect?

Given these multiple and systematic inaccuracies in your presentation of data relating to global average temperatures, it is surprising that some journalists have been citing your information in their reports as if it was reliable. I am also surprised that the Foundation continues to claim to be an educational charity when you are disseminating such inaccurate information through your website. Or perhaps your secret sponsors are funding you to mislead the public and the media?

Yours sincerely,

Bob Ward

Policy and Communications Director
Grantham Research Institute on Climate Change and the Environment
London School of Economics and Political Science
Houghton Street
London WC2A 2AE
https://www.lse.ac.uk/grantham

______________________________________________________________________

Categories
Acid Ocean Climate Change Climate Chaos Global Warming Incalculable Disaster Major Shift Science Rules The Data Tree Family

This is how it is #4

Very long-lived trees tell the story of the last 5,000 years or so.

The gradual cooling of the Holocene interglacial is overtaken by a truly anomalous warming over the last few hundred years.

How unusual have conditions been in the last few hundred years ? The carbon 13 isotope can give us one point of view [ Boehm et al. (2002) ] :-

And the oxygen 18 isotope can add detail about climatic changes not readily apparent from the carbon isotope record [ Berkelhammer and Stott (2008) ] :-

The balance of oxygen isotopes in plants in this study provide some perspective on rainfall and storm patterns, which appear to have started changing before significant temperature changes came into view.

Depletion of oxygen from the atmosphere provides evidence that the accumulation of carbon dioxide is from the oxidation (burning) of fossil fuels :-

Shaffer et al. (2009)

But we’re going to have a carbon crisis in the oceans from a combination of acidification and thermal stress, long before we have an oceanic oxygen crisis :-

NOAA Weekly Coral Watch Forecast

Categories
Bait & Switch Climate Change Delay and Deny Divide & Rule Fair Balance Global Warming Hide the Incline Media Science Rules Social Chaos The Data

Met Office Reports : Media Opinion Differs

Image Credit : Hobos 4 Life

Oo, it’s so hard knowing which version of reality to plump for, if you have to judge by the headlines alone.

These articles were published on the same day, based on the same report from the Meteorological Office, in different high quality newspapers :-

https://www.guardian.co.uk/environment/2010/nov/26/global-warming-met-office

“World is warming quicker than thought in past decade, says Met Office : Report comes as scientists predict 2010 could be hottest year on record : Damian Carrington, The Guardian, Friday 26 November 2010 : The world warmed more rapidly than previously thought over the past decade, according to a Met Office report published today, which finds the evidence for man-made climate change has grown even stronger over the last year…”

https://www.telegraph.co.uk/earth/environment/climatechange/8159991/Global-warming-has-slowed-because-of-pollution.html

“Global warming has slowed because of pollution : Global warming has slowed in the last decade, according to the Met Office, as the world pumps out so much pollution it is reflecting the sun’s rays and causing a cooling effect. By Louise Gray, Environment Correspondent, 26 Nov 2010 : The latest figures from more than 20 scientific institutions around the world show that global temperatures are higher than ever. However the gradual rise in temperatures over the last 30 years is slowing slightly. Global warming since the 1970s has been 0.16C (0.3F) but the rise in the last decade was just 0.05C (0.09F), according to the Met Office. Sceptics claim this as evidence man made global warming is a myth…”

I think I’ll go with Damian Carrington’s version, because at least he mentions more than one possible reason for why Global Warming hasn’t been accelerating as much in the last decade as the ones immediately prior.

Despite the slow down in acceleration, the temperatures are still rising, so there’s no need to use the word “cooling” in Louise Gray’s sub-heading.

And there’s no reason at all for Louise to mention the anti-science so-called “sceptics”, who are actually deniers. They would deny the Moon was made of rock, if they could manipulate the tiniest piece of evidence, or twist the most innocent of words, to make it appear that there were uncertainties about the exact composition of the samples taken from Earth’s satellite by the NASA astronauts.

There is still an outside probability that the Moon could be made of cheese, folks, according to the type of argument put forward by the sceptic-deniers.

But as we all know, that’s impossible, because the Moon landings were faked, and in fact, the Moon is only painted onto the sky dome, as it isn’t actually there any more as it was removed during an undocumented altercation between nuclear states some time in the 1990s.

Categories
Bad Science Climate Change Climate Chaos Global Singeing Global Warming Green Investment Green Power Hide the Incline Media No Pressure Non-Science Political Nightmare Regulatory Ultimatum Renewable Resource Science Rules The Data Unqualified Opinion

A Fairy Castle of Froth

Well, it would seem the wheels have definitely come off the Climate Change sceptic-denier trolley bus, and the passengers are raving, and metaphorically drowning in their own pus-riddled intellectual bile, judging by the spluttered, splattered comments I am receiving on this web log.

Wegman is going down (the anti-science, anti-Hockey Stick Wegman Report, you understand, not the man himself) – and I mean down; down to the depths of dissmissal and reproach, and scorn mountains will be heaped, and his “strange scholarship” will be ribbed and ridiculed and his assertions and claims fobbed off for ever more, it seems, by those whose opinions really count :-

https://deepclimate.org/2010/11/16/replication-and-due-diligence-wegman-style/

https://deepclimate.org/2010/09/26/strange-scholarship-wegman-report/

https://climatechangepsychology.blogspot.com/2010/11/turns-out-climate-skeptics-favorite.html

“Turns out climate skeptics’ favorite report (the Wegman Report) might not be as scientific as Congressman Joe Barton claims…”

We’re talking pit-wise plumbing here, the nether reaches of the pile of tried-and-rejected hypotheses. We’re talking dearie-dearie-me, what a mess have we got here, then ? :-

https://climateprogress.org/2010/11/21/wegman-exposed-experts-find-shocking-plagiarism-in-2006-climate-report-requested-by-joe-barton-r-tx/

Michael Mann was right. You, dear sceptic-deniers, are wrong. Even the Daily Mail newspaper says so, and don’t retort that, of course, the Daily Maelstrom is not exactly the Source of All Validity, and testily question why I trust the Daily Maul when it agrees with me, and not otherwise :-

https://www.dailymail.co.uk/news/article-1332347/Influential-climate-change-report-copied-Wikipedia.html?ito=feeds-newsxml

“Influential climate change report ‘was copied from Wikipedia’ : By DAILY MAIL REPORTER : 23rd November 2010 : Research questioning the validity of global warming was copied from Wikipedia and textbooks, it has been claimed. A report by statistician Edward Wegman criticised earlier research led by scientist Michael Mann that said global temperatures were highest in the last century than the previous 1,000 years. But according to plagiarism experts, ‘significant’ sections of the 91-page report were lifted from ‘textbooks, Wikipedia and the writings of one of the scientists criticised in the report’…”

You can take or leave your truth universe, and the Daily Mall certainly does that, but I’ll stick with the data, thanks, the hard-won, carefully-kept, un-fudged, un-compromised actual measurements…

Categories
Climate Change Global Warming Science Rules

Climate Science Rapid Response Team

Well, it has a different name than the one I suggested (CURRU – the Climate Unscience Rapid Response Unit), but it’s essentially the same thing – a fast-acting scientific response to your Climate Change questions :-

https://www.climaterapidresponse.org/

https://profmandia.wordpress.com/2010/11/22/official-launch-of-the-climate-science-rapid-response-team/

Whether you are a tired journalist late at night trying to piece together the jigsaw that is a Press Release to make some kind of news briefing out of it, or a tired scientist wanting to report a media failing in Climate Change communications, this is the service you need.

The Climate Science Rapid Response Team are the people you go to to confirm or deny the significance (statistical or otherwise) of new research papers, who, if you’re in the role of lawmaker or politician, the people you can approach to iron out your mental wrinkles of confusion.

We will take back trust in Science. We will restore the train engine to the front of the carriages – Climate Change science is going places – on track and at speed.

Join us.

Categories
Climate Change Global Warming Science Rules

All Bets Are On

Image Credit : NASA GISS

I’m not burdened with a gambling addiction, so I sha’n’t be taking part myself, but I suspect it might be possible to lay bets on 2010 being the hottest year of the instrumental record ever since the beginning of relatively accurate machined-based measurements began, globally averaged.

The question you have to ask yourself is this : will November and December be cold enough everywhere to knock the year-to-date temperatures off their reigning warm perch ? Or will the Autumn “dip” in global temperatures be more than compensated for by a warmer-than-average December ?

The La Nina phase of the El Nino-Southern Oscillation is set to continue on into next year – but it’s cooling effect has petered out, apparently, and it seems like temperatures will start to rise again.

Categories
Bad Science Climate Change Global Warming Non-Science Science Rules The Data Tree Family

Hot Old Forests

https://www.theregister.co.uk/2010/11/12/global_warming_good_for_rainforests/

The Register reports that way back, way back, when the rainforests were good and hot, they prospered and life proliferated.

“Global warming is actually good for rainforests, say boffins” reads the headline from Lewis Page, “plus 3 degrees C, 1000 parts per million Carbon Dioxide did jungles a world of good last time”.

Not quite, Lewis old chap. Not quite.

1. The change in global temperatures at the Paleocene-Eocene border was only “rapid” in geological time – at around 20,000 years for the whole event. Plenty of time for rainforests to adapt. Not like now.

2. “There is no evidence for enhanced aridity in the northern Neotropics”, says the Abstract of the research paper “Effects of Rapid Global Warming at the Paleocene-Eocene Boundary on Neotropical Vegetation” by Jaramillo C. et al., in Science, 12 November 2010, Volume 330. Number 6006, Pages 957 – 961, DOI: 10.1126/science.1193833

Yet evidence of severe droughts in the Amazonian rainforest area today makes the analogy with the Paleocene-Eocene Thermal Maximum rather thin. With the current incredibly fast rate of warming in South America, it’s unlikely that regular, intense, droughts are going to reduce in the rainforest area.

Added to the current data, there is every reason to believe that the climate in the tropics was very different at the time of the PETM – the Americas had not yet met, and no Gulf Stream northwards existed.

3. “”It is remarkable that there is so much concern about the effects of greenhouse conditions on tropical forests,” says Jaramillo’s Smithsonian colleague Klaus Winter”, write Lewis Page. Klaus, who ? He’s not even listed on the research paper author listing. Does Mr or Dr Winter have anything to do with this research ? Why does Lewis Page quote hiim ?

4. Have you seen the organisations that contributed to this research ? They include “Colombian Petroleum Institute”, “Petróleos de Venezuela S.A.” and “Agencia Nacional de Hidrocarburos, Bogotá, Colombia” and a number of mining companies. What do they want out of research into rainforest productivity 55 million years ago ?

5. Have we talked about the massive extinction of animal life that took place at the PETM ? Well, perhaps we should…

I wonder what Dr Simon Lewis, rainforest expert, will make of this latest “atrocity” from The Register ?
[ UPDATE : The Daily Mail reported Dr Simon Lewis’ views some way down in an article on the subject here. By e-mail, Dr Simon Lewis wrote to me, “[One] obvious point is they are happy to extrapolate 56 million years to now from three points in a tiny corner of South America, which is a bit different from their usual views about historical proxy data…” ]

When I get the access to this report, I will need to delve deeper into the reasons why Lewis Page has proved, once again, that he doesn’t understand current Climate Change science, and doesn’t understand why the climates of yesteryear often have very little to say about the climate of today and tomorrow.

Categories
Climate Change Extreme Weather Global Warming Science Rules

Awesome but Dangerous

https://wonkroom.thinkprogress.org/2010/10/27/chiclone-of-denial/

“Global Boiling: Continental ‘Weather Bomb’ Hits Midwest With Power Of Cat Three Hurricane”

https://climateprogress.org/2010/10/27/strongest-storm-ever-recorded-in-the-midwest/

“Masters: “Strongest storm ever recorded in the Midwest smashes all-time pressure records” : ‘Weather bomb’ hits Midwest with power of major hurricane”

Categories
Climate Change Climate Chaos Energy Change Energy Revival Global Singeing Global Warming Green Investment Growth Paradigm Oil Change Regulatory Ultimatum Renewable Resource Resource Curse Science Rules Social Change

The Right To Evolve

Image Credit : Oil Change International

https://news.yahoo.com/s/afp/20101028/sc_afp/franceenvironmentclimatewarming

“Global warming ‘unquestionably’ due to humans: France : Global warming exists and is unquestionably due to human activity, France’s Academy of Science said in a report published Thursday and written by 120 scientists from France and abroad. “Several independent indicators show an increase in global warming from 1975 to 2003. This increase is mainly due to the increase in the concentration of carbon dioxide,” the academy said in conclusion to the report. “The increase in carbon dioxide, and to a lesser degree other greenhouse gases, is unquestionably due to human activity,” said the report, adopted unanimously by academy members. The report contradicts France’s former education minister Claude Allegre, a geochemist, who published a book called “The Climatic Deception” which claimed that carbon dioxide was not linked to climate change. The report was commissioned in April by Minister for Research Valerie Pecresse in response to hundreds of environmental scientists who complained that Allegre in particular was disparaging their work. Allegre is a member of the Academy of Sciences and also signed off on the report. “He has the right to evolve,” the academy’s president Jean Salencon said. Pecresse said: “The debate is over.”…”

To my Climate Change sceptical readers, you, too have the “right to evolve”.

Come on over from the dark side to the side of light, life and understanding.

Stop the blame game, the game of suspicion, nitpicking, paranoia and irrationality, and reflect on the path of right dealing, factual research, and true and cooperative human endeavour.

Human beings are genetically encoded for pragmatic policies and practical decisionmaking; yet sometimes the fastest route to a solution is the least successful in the longer term.

Digging high calorie substances out of the ground and burning them in very large quantities is having a negative effect on the ability of the Earth to sustain Life. Ponder that for a while.

Eventually virtually all mining activities will be curtailed. As an elderly relative commented to me when discussing recycling – if we recycled all materials then people wouldn’t have to risk their lives going deep underground for new resources – like those poor miners in Chile and China.

The mines are getting deeper and more dangerous – something the Gulf of Mexico ecosystem encountered to its irrecoverable loss earlier this year.

We can live without mining. We can garner energy without mining. We can live having all our wants and needs provided for by the power of sunlight and the winds and waves it drives, and by the gravitational pull of the Moon turning the tides restlessly.

That kind of productivity will keep us in industrial development for as long as we survive as a species, whilst preventing destruction of our habitat, which would finish us off as a species altogether, along with millions of others.

That’s the kind of evolution we need.