| They may have been BESTed, but the climate change denier spooks and ghouls are still fluttering about like deranged rabid bats. Here is a draft of a letter I am considering sending to somebody in an organisation under which I serve… | |
|
31st October 2011 Dear XXXXXXXXXXX, It seems to me that you are labouring under several false impressions of the consensus in science regarding global warming and climate change. For example, you do not appear to accept that global warming is taking place, a fact that is evidenced by over a century of data. And as another example, you do not appear to accept that global warming is causing climate change, a scientific reality evidenced by countless studies. However, I’m not going to guide you to the peer-reviewed science for those points. All I want to do in this particular communication is offer you a popular critique of one of your key arguments, and challenge you to check your sources. |
|
Category: Global Warming
Categories
Behaviour Changeling Big Society Climate Change Demoticratica Divide & Rule Economic Implosion Extreme Weather Faithful God Financiers of the Apocalypse Foreign Interference Global Heating Global Singeing Global Warming Libertarian Liberalism Mass Propaganda Media Military Invention Near-Natural Disaster Neverending Disaster No Blood For Oil Nudge & Budge Peace not War Policy Warfare Political Nightmare Protest & Survive Public Relations Social Capital Social Change The Power of Intention The War on Error Unutterably Useless Utter Futility Western Hedge
Occupy your mind #7

| So, after rumours and quashings of rumours, Giles Fraser has resigned as canon chancellor of St Paul’s Cathedral, “resigned in protest at plans to forcibly remove demonstrators from its steps, saying he could not support the possibility of “violence in the name of the church”…Fraser, a leading leftwing voice in the Church of England, would resign because he could not sanction the use of police or bailiffs against the hundreds of activists who have set up camp in the grounds of the cathedral in the last fortnight.” |
But just why did Giles Fraser resign ? What has it achieved ? What could it possibly achieve ? Now he’s no longer in the Cathedral organisation he cannot influence what happens. What pressures has he had to endure behind the scenes that gave him no option but to jump ? Somebody I know has been praying that there would be heavy rain in London, just so the conditions would be impossible for the Occupyer camp to continue; that they would have to pack up and go home. What on Earth is this @OccupyLSX protest for ? A camp of principle, to defend the right to protest ? A camp of demands, pursuing a just economics and a just society ? A camp of non-violence, when it deliberately provokes a stand-off between demonstrators and police forces ? How can the Occupyers claim to be peaceful when they know their actions have a fragmentation bomb-like effect on the society around them ? How can the Cathedral Campers evidence their intentions for a juster, saner, economic system, when the net effect of their actions is likely to be a huge law court struggle at taxpayer expense ? It’s not a revolution, it’s an irritation – or at least that is the way that it will continue to be viewed by the governing authorities. Somebody on the inside track of campaigning in London has told me that the Occupy protest is destined to transmogrify into a Climate Refugee tent city in late November, early December. If it survives that long, then at least it can claim to be a piece of living art reflecting what is happening around the world because of climate change disasters. Unless and until the Occupyers can take on relevance, everybody with even just a slightly-left-of-centre agenda will attempt to co-opt the Occupy London camp for their own purposes. Remember, dear Occupyers, you are not “rising up” like the people in Libya – they were supplied with arms from around the world, forces overt and covert from Qatar, Europe and quite possibly America, and fed into a huge psychological operations narrative, ably supported by the media. The Libyan conflict wasn’t about Colonel Muammar Gaddafi, may he rest in peace. The information management of the North African and Middle Eastern unrest shows that mass propaganda still works, and that media consumers continue to fall for the same fabrications, time after time. | |
Categories
Advancing Africa Bad Science Bait & Switch Be Prepared Behaviour Changeling Big Picture Burning Money Carbon Army Carbon Capture Carbon Commodities Carbon Taxatious Climate Change Conflict of Interest Corporate Pressure Cost Effective Delay and Deny Demoticratica Direction of Travel Droughtbowl Eating & Drinking Economic Implosion Efficiency is King Emissions Impossible Energy Change Energy Insecurity Evil Opposition Faithful God Feed the World Financiers of the Apocalypse Food Insecurity Foreign Interference Foreign Investment Fossilised Fuels Freak Science Freemarketeering Geogingerneering Global Warming Green Investment Human Nurture Hydrocarbon Hegemony Low Carbon Life Major Shift Mass Propaganda Media Military Invention Money Sings Neverending Disaster No Blood For Oil Non-Science Not In My Name Nudge & Budge Oil Change Peace not War Peak Emissions Peak Energy Peak Oil Petrolheads Policy Warfare Political Nightmare Public Relations Realistic Models Regulatory Ultimatum Science Rules Scientific Fallacy Social Capital Social Change Solution City Stop War Sustainable Deferment Technofix Technological Fallacy Technological Sideshow Technomess The Data The Myth of Innovation The War on Error Unqualified Opinion Unsolicited Advice & Guidance Unutterably Useless Utter Futility Vain Hope Voluntary Behaviour Change Wasted Resource
The Problem of Powerlessness #2
| On Wednesday, I received a telephone call from an Information Technology recruitment consultancy. They wanted to know if I would be prepared to provide computer systems programming services for NATO.
Detecting that I was speaking with a native French-speaker, I slipped into my rather unpracticed second language to explain that I could not countenance working with the militaries, because I disagree with their strategy of repeated aggression. |
|
| I explained I was critical of the possibility that the air strikes in Libya were being conducted in order to establish an occupation of North Africa by Western forces, to protect oil and gas interests in the region. The recruitment agent agreed with me that the Americans were the driving force behind NATO, and that they were being too warlike.
Whoops, there goes another great opportunity to make a huge pile of cash, contracting for warmongers ! Sometimes you just have to kiss a career goodbye. IT consultancy has many ethical pitfalls. Time to reinvent myself. I’ve been “back to school” for the second university degree, and now I’m supposed to submit myself to the “third degree” – go out and get me a job. The paucity of available positions due to the poor economic climate notwithstanding, the possibility of ending up in an unsuitable role fills me with dread. One of these days I might try to write about my experiences of having to endure several kinds of abuse whilst engaged in paid employment : suffice it to say, workplace inhumanity can be unbearable, some people don’t know what ethical behaviour means, and Human Resources departments always take sides, especially with vindictive, manipulative, micro-managers. I know what it’s like to be powerless. |
|

Categories
Animal Kingdoom Bad Science Big Picture Climate Change Climate Chaos Climate Damages Demoticratica Direction of Travel Extreme Weather Fair Balance Feel Gooder Freshwater Stress Gamechanger Global Heating Global Singeing Global Warming Heatwave Human Nurture Incalculable Disaster Media Optimistic Generation Peace not War Political Nightmare Protest & Survive Rainstorm Scientific Fallacy Social Capital Social Change Social Chaos Stirring Stuff The War on Error Wildfire
Adam Curtis : Chaotically Unstable
I’m looking quizzical, rubbing my chin. Adam Curtis appears to have lost control of his mind, or at the very least, is showing signs of unhealthy self contradiction. Where are the checks and balances ?
At the start of Part 2 of “All Watched Over by Machines of Loving Grace”, he unpicks, and, I would suggest, stamps on, the idea that ecosystems are networks of feedback loops, tending to re-balance. And then at the end of the same presentation, he asserts that human revolutions fail, and society folds in on itself and returns to the state of power and control it was in before. Now which is it to be, Adam Curtis ? Self-correcting stability or non-correcting ebbs, flows and shifting sands ?

From the consistent and unrelenting rise in global carbon dioxide emissions, you would never have guessed that there’d been a downturn. But that’s because energy is cheap, and easily substitutes for economic production, labour and resources – within limits.
Fiona Harvey has gathered and presents some astonishing admissions from various key speakers on the issue of emissions, ahead of the annual mid-year United Nations climate change talks in Bonn :-
https://www.guardian.co.uk/environment/2011/may/29/carbon-emissions-nuclearpower
“Worst ever carbon emissions leave climate on the brink : Exclusive: Record rise, despite recession, means 2C target almost out of reach : Fiona Harvey, Environment correspondent, guardian.co.uk, Sunday 29 May 2011 : Greenhouse gas emissions increased by a record amount last year, to the highest carbon output in history, putting hopes of holding global warming to safe levels all but out of reach, according to unpublished estimates from the International Energy Agency. The shock rise means the goal of preventing a temperature rise of more than 2 degrees Celsius – which scientists say is the threshold for potentially “dangerous climate change” – is likely to be just “a nice Utopia”, according to Fatih Birol, chief economist of the IEA. It also shows the most serious global recession for 80 years has had only a minimal effect on emissions, contrary to some predictions…”

Carbon dioxide is not the only greenhouse gas, although it’s the one most scientists worry about on the long term scale. Its diversion out of deep storage into the active global carbon cycle is causing global warming, and that, the evidence strongly shows, is causing widespread and disruptive climate change.
But in short timeframes, methane is the gas on everybody’s worried lips. The sources of methane are affected by global warming, and methane emissions cause strong global warming in the short term, so it’s a positively augmenting feedback, self-amplifying, and causing grave concern in many environmental policy seminars.
People often point the finger at the digestive systems of ruminant livestock when they want to pinpoint a scapegoat for rising methane emissions, but they should perhaps look closer to their own bathrooms and kitchens and their underfloor gas pipelines.
Categories
Bait & Switch Carbon Commodities Carbon Taxatious Climate Damages Conflict of Interest Contraction & Convergence Corporate Pressure Cost Effective Dead End Divide & Rule Economic Implosion Emissions Impossible Energy Change Energy Disenfranchisement Energy Revival Energy Socialism Financiers of the Apocalypse Fuel Poverty Global Warming Growth Paradigm Hydrocarbon Hegemony Tarred Sands Unqualified Opinion Unsolicited Advice & Guidance Unutterably Useless Utter Futility Vain Hope Wasted Resource
Carbon Dioxide – a virtual, negative commodity
https://www.cato.org/event.php?eventid=7999
I found this excellent little CATO Institute debate somewhere in my Twitter stream, and I watched the whole of it, despite the annoying accents and speaking styles of the speakers, and the insider economics references to Pigou and Coase (they’re only theorems, you know).
I thought that Kate Gordon made some excellent rebuttals to Andrew Morriss’ whining, pedantic free marketeering, and I was with her right up until the last few frames when she said that the Center for American Progress, of course, supports a carbon tax, as this is, of course, the best way to prevent Carbon Dioxide emissions.
Such disappointment ! To find that somebody so intelligent cannot see the limitations of carbon pricing is a real let down. I tend to find that American “progressives” on the whole are rather wedded to this notion of environmental taxation, “internalising the externalities” – adding the damages from industrial activities into the cost of the industrial products. I do not see any analysis of the serious flaws in this idea. Just what are they drinking ? What’s in the Kool-Aid ?
I cannot waste my time counting how many cut-and-paste e-mails I receive, and usually I just junk them, but I thought this one seemed sufficiently personalised to actually respond to it.
from Energy Collective
to jo abbess
date Fri, May 27, 2011 at 2:29 AM
subject You Are Invited! Blog With The Energy Collective
Dear Ms. Abbess:
…I am…at The Energy Collective (TEC). TEC is a pragmatic anti-carbon, tech-agnostic blog that aims to stoke the discussion on climate and energy solutions by bringing together the smartest climate and energy bloggers on the planet. We are at about 70k hits per month, and growing quickly. Our users are smart, engaged, energy professionals located all over the world, but concentrated in the US.
I stumbled over your blog, I think through Twitter, and am delighted by it. I like your straight-forward, unflinching writing style, as well as your lack of tolerance for climate deniers. I would like to invite you to blog with us at The Energy Collective. The deal here is a trade: you grant TEC permission to syndicate selected posts from your RSS for free, and we post, promote and leverage your content to get it in front of as many eyes as possible. We strive to create as much value as possible for our bloggers, and often offer contract writing opportunities, chances to participate as experts in our webinars, free or discount conference access, professional connections, and more.
Many news articles now follow a predictable path. Some awe-inspiring, statistics-shaking weather event hits town – in the case of Joplin, literally. Then some people muse about whether these extreme events could have anything to do with Global Warming. Then some other people smother the idea very publicly. “No one weather event can be attributed to Climate Change !”, they insist, and yes, in the grand scheme of things they’re right – you cannot say for certain that one freak tornado, hurricane, flood or storm can be cast iron guaranteed to have been caused by atmospheric heating and increased sky water vapour. There is No Connection, official, and we can all breathe a sigh of relief and donate to a worthy clean-up cause.
Categories
Texas travel advisory
[ UPDATE : Texas Governor proclaims three days of prayer for rain ]
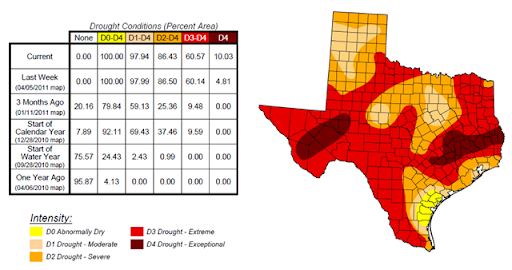
Texas ? My advice is – don’t go there. Not only does it have numerous social problems, it’s also in the midst of a hellfire makeover, caused by extensive drought :-
https://www.statesman.com/news/local/fires-rage-through-much-of-texas-more-than-1418294.html
“Fires rage through much of Texas; more than 1 million acres burned : April 20, 2011 : Several massive wildfires in North and West Texas continued to rage Tuesday, racing through parched fields and woods and adding to a sweeping acreage toll that has reached almost 1.2 million in less than two weeks. A wildfire spanning four counties west of Fort Worth near Possum Kingdom Lake has consumed nearly 150,000 acres, destroyed 150 homes and a church, and forced hundreds to flee since it began Friday, Texas Forest Service spokesman Marq Webb said. The fire, which nearly doubled in size in a day, is one of more than 20 active fires that the Forest Service is fighting statewide in an April that has been plagued by a fierce drought, high temperatures and gusting winds – conditions that have allowed wildfires to ignite and spread quickly in several parts of the state, including Austin…”
The situation is so bad, that the God Squad has been moved to participate, some in practical ways and some in the spiritual department. People are dying, but meanwhile, some in the Heavenward crowd are in denial about Climate Change. Seems that some tombstone-headed American Christians would rather crucify their country than admit that Global Warming Science is right.
State policy on fighting fire seems rather contrary to the trends – and that’s probably because “big government” social budgets needs to be cleansed of too much “red tape”.
Will Texas become uninhabitable, with terrain where nothing can grow; the domain of wind farms, solar fields and duststorms ?
It may be Easter, but it’s not a Good Friday. Happy Scorched Earth Day 2011 !

Categories
Be Prepared Big Picture Big Society Carbon Army Cool Poverty Energy Disenfranchisement Energy Socialism Fuel Poverty Global Heating Global Singeing Global Warming Green Investment Green Power Health Impacts Heatwave Human Nurture Low Carbon Life Money Sings National Socialism Policy Warfare Political Nightmare Protest & Survive Social Capital Social Change Social Chaos Wasted Resource
Cool poverty

They’ve never had it so cold. The British have just shivered through another long, centrally heated winter, and people are receiving enormous gas bills. Social campaigners and parliamentarians are rightly concerned that a clutch of harsher winters and rising energy costs could reverse gains made in tackling fuel poverty. The UK Government’s recent Budget announcement to reduce fuel poverty assistance payments is another blow to maintaining decent and warm homes for the vulnerable, the elderly and children. Proposals to cap the amount that energy companies can charge people in their bills is welcomed by some, but feared by others – as it could jeopardise energy company funding for the Green Deal – a free-to-the-consumer loan scheme for insulation and renewable energy installation. And there’s another problem waiting in the wings. Unlike the United States and Australia, the average British home doesn’t have air conditioning, and it costs real money to install it. If outsized summer heatwaves continue to pop up more frequently in Europe, UK households will face “cool poverty” in summer – a lack of cooling.

Click here for the Weekly ENSO advisory.
It seems possible that the Pacific is returning to neutral El Nino conditions, or possibly a full-blown El Nino. If total solar irradiance is increasing due to a renewed sun cycle, an emerging El Nino this Northern Hemisphere summer could make for scorching temperatures.
To add to the aggravation, the Earth’s energy imbalance is leading to higher surface temperatures still, despite ocean cycling of heat to the depths and atmospheric aerosol effects on radiation equilibrium.
James Hansen of NASA and his colleagues are arguing for better measurements of the effect that airborne particulates are having, and sounding the warning siren yet again about Global Warming and the time delay between increased radiative forcing and increased surface warming.
The globe is warming. It hasn’t stopped, and it isn’t getting any cooler. As time goes by, the science becomes ever more verified :-
https://www.columbia.edu/~jeh1/mailings/2011/20110415_EnergyImbalancePaper.pdf
…giving Climate Change action “Earth Hour” a professional, clean-shaven edge.
Categories
Be Prepared Climate Change Climate Chaos Climate Damages Energy Change Energy Revival Environmental Howzat Extreme Weather Floodstorm Fossilised Fuels Global Singeing Global Warming Green Investment Green Power Health Impacts Incalculable Disaster Major Shift Marvellous Wonderful Near-Natural Disaster Neverending Disaster Political Nightmare Rainstorm Regulatory Ultimatum Screaming Panic Social Change Social Chaos The Power of Intention
Pakistan : Inundation Nation
[ UPDATE : Don’t tell me. I know the images are mostly from India, but the music is Punjabi… ]
https://www.thenews.com.pk/TodaysPrintDetail.aspx?ID=32170&Cat=6&dt=2/21/2011
“Draft of national climate change policy finalised : Noor Aftab : Monday, February 21, 2011 : Islamabad : The draft of National Climate Change Policy has been finalised after two years of deliberations and now the Environment Ministry would present it to the federal cabinet for final approval, the sources told The News here on Sunday. The sources said the recommendations in the draft would certainly test the government’s commitment as it has been proposed to go for alternative energy resources instead of using fossil fuel, considered one of the major reasons for environmental degradation. The sources said the draft recommendations prepared by a core group of the Environment Ministry mainly focuses on two areas including adaptation and mitigation with an aim to enable the country to cope with fast increasing environmental challenges. One of the top officials of the Environment Ministry told this correspondent that continuity of casual approach towards environmental sector has now made economic managers and policy makers feel the heat as environmental degradation has started costing five per cent of gross domestic product (GDP) in Pakistan…”
“Sunday, February 20, 2011 : UK to keep helping Pakistan’s flood victims: Sayeeda Warsi : LAHORE: Baroness Sayeeda Warsi, a British cabinet minister of Pakistani-origin, said on Saturday that the United Kingdom would continue supporting Pakistan in the post-flood operations. “Today I have been heartened to see and hear how the UK is helping millions of people in Pakistan rebuild their lives, but there is much more to do, with widespread malnutrition and the risk of disease outbreaks,” Warsi said while talking to reporters in Islamabad. The primary purpose of Warsi’s visit to Pakistan is to learn how the country is recovering, what more needs to be done, and to see how more than Rs 27.7 billion from British people is supporting the flood victims. “When I was here exactly six months ago in August at the peak of the floods with the UK International Development Secretary Andrew Mitchell I saw scenes of devastation,” the British lawmaker recalled. She said that some areas of Sindh were still under water, adding that reconstruction of millions of houses, bridges and schools that were destroyed would take years…”
Received by e-mail from Australia
__________________________________________________________
18 January 2011
Hi Jo,
Thanks for this. The thoughts and prayers of […] friends are much appreciated.
Yes, the flooding across huge swathes of eastern Australia ([Queensland], [New South Wales], Victoria, Tasmania) has been terrible. The sheer scale of it is hard to comprehend. It hasn’t affected the areas of New South Wales where my family lives. We are, however, experiencing a very sticky and rainy Summer.
Queensland
Three quarters of the state of Queensland, an enormous area, has been declared a disaster zone. Major population centres, including Brisbane, Bundaberg and Toowoomba have been affected, as well as various towns.
Horribly, in the Lockyer Valley, a sudden tide of water swept people to their deaths. Some 20 people have died across the state and there are still about ten missing.
The impact on farmers from the floods is severe. Mining has also been affected – including coal export – which has been talked about in the media largely without irony.
The [Queensland] Premier has announced a commission of inquiry into the disaster, and has launched a flood appeal. Emergency funding packages are being made available to people affected. A flood recovery taskforce has been established.
It has been terrible, but at the same time I have been struck throughout how relatively well equipped Australia is to cope with such circumstances – in contrast, for example, to Brazil and Pakistan.
I am also glad to see how communities come together and support each other. I pray for such coming together before – not just after – the fact in the face of the challenge of climate change.
Victoria
Dozens of towns in Victoria have also been flooded. The town of Horsham, on the Wimmera River, has seen its largest ever recorded flood.
As for Queensland, emergency funding, a flood appeal, and a recovery taskforce have been established. As far as I am aware, there have as yet been no deaths in Victoria.
The Churches’ Responses
Churches across the country are offering support to flood affected communities.
To read about various appeals and statements, see :-
For an account of ecumenical cooperation, see :-
https://www.journeyonline.com.au/showArticle.php?articleId=2657
[…] might also be interested to see a flood liturgy and intercessory prayers which were written by members of the Uniting Church […] :-
https://www.journeyonline.com.au/showArticle.php?articleId=2654.
The intercessory prayer says :-
“Creator God,
We pray for all those in farms, small towns, and cities in Australia whose lives have been disrupted and whose dreams have been dashed by the floods that have devastated the country.
We pray for those who have lost their homes, their cars, their treasured possessions, their crops, their animals, and their livelihoods. It is a terrible thing to be homeless and helpless.
Be with and sustain those whose entire world has been torn apart and washed away.
Assuage their fears and be patient with their anger.
Grant them patience and hope that eventually they can rebuild their lives and start afresh.
We are grateful to the emergency flood workers and all those who were heroes in helping those in distress during the floods.
May they continue their missions of mercy.
Be with those who are caring for flood victims that their compassion and presence will be life-sustaining.
May they continue their missions of mercy.
We are thankful for those who serve others and provide us all with the inspiration to do the same.
We are sending love, peace, strength, and courage to all our brothers and sisters in Australia.
May this nightmare end shortly.
May healing begin swiftly.”
It is too soon to estimate the damage bill, and the crisis is ongoing, but I have heard figures of up to [AUD] $20 billion.
See the following article about the links between climate change and the flooding : https://www.climateactioncentre.org/floodsclimatechange.
What seems clear is that higher ocean temperatures result in increased evaporation, increasing the amount of rain in this current La Nina cycle that is affecting eastern Australia.
This flooding comes on the back of severe drought, and in the middle of a consultation process in the development of the Murray-Darling Basin Plan – a national plan of management for the huge Murray-Darling river system, which runs through [Queensland], [New South Wales], [Australian Capital Territory], Victoria and South Australia.
The Murray Darling Basin has been overexploited and placed under severe stress – stress that may be temporarily abated with flooding but which will inevitably return.
Peace and love,
_________________________________________________________

Image Credit : Amelia Gregory
London Rising Tide presents…The Beehive Design Collective’s – ‘The True Cost of Coal’
DATE – Thursday 10th Feb, 2011
TIME – 7.30pm – late – with refreshments after the presentation
LOCATION – London Action Resource Centre : 62 Fieldgate Street, Whitechapel, London, E1 1ES
‘The True Cost of Coal’ will take you on an interactive visual tour of the connections between coal mining, climate change, the ever-expanding capitalist economy, and the struggle for justice in local communities affected by the coal industry around the world.
‘The True Cost of Coal’ is a recently completed project by the Beehive Collective (part of the Rising Tide North America Collective), who create portable murals of collaboratively produced illustrations that tell an engaging and disturbing story.
Learn how the artwork is created by the collective and how they use their posters to run community workshop and for storytelling. The True Cost of Coal poster they have produced is quite staggering – check it out at :-
https://www.beehivecollective.org/english/coal.htm
Their visually stunning, large scale Black + White graphics depict social justice and raising ecological consciousness in an unusual and highly creative way.
Come along to find out more at LARC, 7.30pm, Thurs 10th Feb.
For more information on London Rising Tide :-
https://www.londonrisingtide.org.uk
London Rising Tide
c/o 62 Fieldgate Street, London E1 1ES
Telephone: 07708 794665
https://www.facebook.com/people/Rising-Tide-UK/515246801
Please share your art with the Art Not Oil project :-
https://www.artnotoil.org.uk
See also the Camp for Climate Action site :-
https://www.climatecamp.org.uk
https://www.networkforclimateaction.org.uk
Climate Indymedia :-
https://climateimc.org
Indymedia London :-
https://london.indymedia.org/


Fred Pearce attempted to lighten the nation’s mood with a jolly little piece about how Climate Change sceptics and scientists are trying to resolve their differences, in a Short Sharp Science piece this week :-
https://www.newscientist.com/blogs/shortsharpscience/2011/02/climate-sceptics-scientists-at.html
Pearce clearly wanted to bring good news and pierce the gloom over continued attacks on Climate Change scientists from the Internet sceptic “community” (which includes a real climate scientist, Judith Curry, pictured smirking above).
However, he appears to have put his foot squarely in his mouth, by recounting what others have now strongly disputed, almost everywhere to near universal disquiet :-
https://scienceblogs.com/deltoid/2011/02/pearcegate.php
“Fred Pearce is going down the David Rose road publishing fabricated quotes. Gavin Schmidt in a letter to New Scientist (so far unpublished there) writes…”
https://rabett.blogspot.com/2011/02/through-glass-darkly.html
“Eli a trusting sort of bunny, likes to believe everyone, but favors cutting the cards. Porky Pearce over at Nude Scientist is taking a shellacking for, as they say, making it up. Gavin might even get a few bob out of it if he were Monckton Minded, but as for now all we have is Dr. Schmidt’s (still unpublished as we go to press) letter sent to the editors…”
https://tamino.wordpress.com/2011/02/03/not-a-misquote-a-nonquote/
“As many of you may be aware, a conference was arranged purportedly to “bridge the gap” between mainstream climate scientists and the so-called “skeptics.” Fred Pearce reported in an article for NewScientist that Gavin Schmidt had declined the invitation to attend because the science was settled so there was nothing to discuss. Quoting from the article: “But the leaders of mainstream climate science turned down the gig, including NASA’s Gavin Schmidt, who said the science was settled so there was nothing to discuss.” This isn’t a misquote — it’s just a fabrication. Schmidt has sent a letter to NewScientist objecting to someone making up such a story…”
https://profmandia.wordpress.com/2011/02/03/fred-pearce-at-new-scientist-making-stuff-up/
“In a recent article in New Scientist journalist Fred Pearce decided to make up a quote by Dr. Gavin Schmidt. Read on to see Gavin’s letter to New Scientist that correct’s Pearce’s Journalism 101 mistake…”
https://scienceblogs.com/stoat/2011/02/porky_pearce.php
“Fred Pearce seems to have made a bit of a career out of being rubbish recently, but has now stooped to just making things up (or, just possibly, that good old journo standby, being so clueless as to what you’re talking about that your paraphrases are so inaccurate as to descend into lies). Anyway, Pearce’s current lies are in the Newt Scientist where he says the leaders of mainstream climate science turned down the gig, including NASA’s Gavin Schmidt, who said the science was settled so there was nothing to discuss. Gavin, of course, said no such thing…”
https://thingsbreak.wordpress.com/2011/02/03/fred-pearce-is-still-a-rubbish-journalist/
“When last we left Pearce, he was enthusiastically attempting mouth-to-mouth resuscitation on the vile, rotting corpse of “He said; She said “journalism”” that has long wreaked havoc on public understanding of climate. Checking in, we now find Pearce has sunk to just making statements up and attributing them to people without their knowledge or consent. Specifically NASA GISS researcher (and RealClimate blogger) Gavin Schmidt…”
What with New Scientist carrying a pseudo-article that is actually an advertisement for Statoil, I think I might nearly be at the point where I cancel my subscription, unless Fred Pearce stands down from having control of environmental reporting or editorial functions at the magazine.
Categories
Mini Hockey Sticks (5)

This new data shows unequivocal evidence of a statistically significant rising trend…
…in the last 12 months of Future Front Month C contracts for ICE Brent Crude Petroleum Oil.
It looks surprisingly similar to the last 60 years of global average temperatures, except the trend in temperatures is steeper :-

Most people looking at the rising price of Brent Crude would be able to work out that there are driving forces.
Surely there cannot be anybody left in the room who believes the global temperature record doesn’t have an underlying driving force (or several) ?
And what does the price of a gallon of gasoline have to do with Climate Change ?
Rapid changes in the price of fossil fuel energy will make it virtually impossible to control the use of fossil fuel energy using special economic policy instruments such as taxes, levies, or quota systems – the changing cost of “conventional” energy resources will completely obscure the signal of carbon pricing or renewable energy incentives :-
https://www.joabbess.com/2011/02/02/market-tinkering/
Economic incentives may not be the way to lower carbon emissions so… :-
…we may have to resort to brute regulation :-
https://www.businessgreen.com/bg/news/1929547/mps-urge-government-ban-coal-fired-power-stations
https://www.adelaidenow.com.au/ban-on-growth-of-coal-power/story-e6frea6u-1225966126453
https://www.dailytelegraph.com.au/news/nsw-act/ban-on-coal-fired-power-plants-in-nsw/story-e6freuzi-1225878660822
https://www.cleanairalliance.org/node/837
Goodbye carrot world. Say hello to the urgent sticks of necessity.
…Meanwhile, the popular movement against coal is growing…
https://burycoal.com/blog/why-bury-coal/
https://www.physorg.com/news/2011-01-coal-industry-fumes-revokes.html
https://www.ilovemountains.org/
https://www.greenpeace.org/usa/en/news-and-blogs/news/Coal-free-tour/
Categories
Be Prepared Big Picture Burning Money Carbon Commodities Carbon Rationing Carbon Taxatious Climate Change Climate Chaos Climate Damages Cost Effective Disturbing Trends Energy Change Energy Revival Extreme Weather Floodstorm Global Warming Green Investment Green Power Incalculable Disaster Major Shift Near-Natural Disaster Neverending Disaster Rainstorm Social Chaos
Australia : Inundation Nation (2)
The key question tonight in Queensland is : how safe can we make the house before morning ?
The second key question that should tonight be asked in Queensland Australia is : are the damages from Climate Change likely to be more expensive than changing our energy sources to stop it ?
https://www.bbc.co.uk/news/world-asia-pacific-12294834
“27 January 2011 : Australia floods: PM Julia Gillard unveils new tax : Julia Gillard announces the details of the new tax : Australia’s Prime Minister Julia Gillard has announced a new tax to help pay for devastating floods that she says will cost A$5.6bn ($5.6bn; £3.5bn) in reconstruction. Ms Gillard said the 12-month tax, starting from 1 July, would be levied on those earning A$50,000 or more, and those affected by floods would not pay. “We should not put off to tomorrow what we are able to do today,” she said…”
“Gillard warms to permanent disaster fund : Phillip Coorey : February 1, 2011 : THE Prime Minister, Julia Gillard, is prepared to entertain the idea of a permanent natural disaster fund if it helps win the support of key independents in both houses. But she is not prepared to bend on the details of her one-off $1.8 billion levy to help with flood reparations in Queensland. As negotiations began with independents yesterday before the legislation for the flood measures is tabled in Parliament next week, Ms Gillard would not rule out a permanent fund. ”We’re happy to have a conversation about the longer term,” she said. But the floods, she said, were ”an extraordinary circumstance which requires a response in the short term”…”

[ UPDATE : Some of the propagandists of the Climategate non-scandal, an event, you may recall, that involved the purloining and publication of thousands of private e-mails, have complained that I published their private e-mail addresses…Oh, such delicious irony ! ]
Monckton’s on his High Court horse, doo dah, doo dah…. yes The Viscount Monckton of Brenchley, christen-named Christopher has had it with the BBC. Really had it. You can almost visualise cartoon steam exploding from his auricles, imagine a purple brow with veins a-popping.
And in the process of winging off a torrent of what feel like huffy-puffy blow-your-house-down e-mails, he has managed to send one to me, possibly by mistake, but who knows, really ? I mean, who really knows what is going on in his Viscountnesses’ mind ? Why has he not succumbed to the inevitable and graciously bowed out from the theatre of contention and meekly joined the Glorious House of Scientific Consensus ?
Let’s repeat it one more time – Climate Change is real and it’s happening now. The mid-range projection for average Global Warming is a rise of around about three degrees Celsius, which will be significant in its impacts on habitats around the world, and at the current three quarters of a degree is already causing major disruptions to rainfall and weather patterns and de-stabilisation of the frozen regions, with knock-on effects for plant and animal life and agriculture, as recognised and evidenced by all the world’s leading science academies.
Discounting a wide range of possible positive feedbacks, global warming to a first order calculation from basic Physics will be somewhat over one degree Celsius for a doubling of Carbon Dioxide; and then in addition, about the same again for the increased atmospheric water vapour, a direct result of the initial Carbon Dioxide-induced warming.
Christopher Monckton, is, in my view, wrong to assert that Climate Sensitivity to increasing greenhouse gases is low, when the basic Physics contradicts him.
=x=x=x=x=x=x=x=x=x=x=x=x=x=x=x=x=x=
From: Christopher Monckton (3rd Viscount of Brenchley)
Sent: 31 January 2011 20:40:47
Re: BBC 4
To: Rupert Wyndham
(R. C. E. Wyndham, ex-Company Secretary, Sage Group);
John Gahan (Farnham Geological Society, New Forest councillor)
Cc: John Gahan (Farnham Geological Society, New Forest councillor); Brice Bosnich (Australian National University, Research School of Chemistry); Christopher Booker (Daily Telegraph columnist), James Delingpole (Daily Telegraph columnist), John Christy (University of Alabama in Huntsville), Nigel Lawson (Global Warming Policy Foundation), Paul Reiter (Pasteur Institute), Richard S. Lindzen (MIT), S. Fred Singer (SEPP), Andrew Collins (BBC Radio Times editor), Benny Peiser (Global Warming Policy Foundation), Gabriel (Gabe) Rychert (Climate Realists), Sally Allix, Angela Kelly, jo abbess, Mark Thompson (BBC Director General), Caroline Thompson (BBC), Anthony Bright-Paul (author), Tony Nicholls, Andrew Montford (Bishop Hill weblog), Humphrey Morison, David Bellamy (naturalist, conservationist), Sonja A. Boehmer-Christiansen (Hull University), Charles Wyndham, Colin Bradshaw (Rowan Studios), Piers Corbyn (Weather Action), Peter Sissons (ex-BBC), Professor Philip Stott, Hans Schreuder (Tech Know), David Evans (Science Speak), Fred Pearce (journalist, The Guardian, New Scientist Magazine), “CWS”, James Naughtie (BBC), John Humphrys (BBC), John Brignell (Number Watch), Kenneth (Ken) Haapala (SEPP), Rodney Leach (Matheson & Co.), “Physics Services”, Melanie Phillips (Daily Mail journalist), Andrew Revkin (New York Times journalist), The Tablet (Catholic newspaper), Andrew Tyrie (UK Parliament), Martin Rees (ex-President, Royal Society), Anthony Watts (Watts Up With That weblog)
Actually it’s a boorish hatchet job of the traditional BBC kind, but I sued them and made them cut it by half an hour and alter or remove some 16 downright errors and unfairnesses in the programme. Pleasingly, they’re going to have to pay quite a large chunk of the court costs (though I’m going to have to pay some too, because although the Beeb had promised me a right of reply their promise meant nothing either to them or to the High Court). – M of B
The Viscount Monckton of Brenchley
—–Original Message—–
From: Rupert Wyndham (R. C. E. Wyndham, ex-Company Secretary, Sage Group)
To: John Gahan (Farnham Geological Society)
Cc: John Gahan (Farnham Geological Society, New Forest councillor); Brice Bosnich (Australian National University, Research School of Chemistry); Christopher Booker (Daily Telegraph columnist); James Delingpole (Daily Telegraph columnist); Christopher Monckton (3rd Viscount of Brenchley); John Christy (University of Alabama in Huntsville); Nigel Lawson (Global Warming Policy Foundation); Paul Reiter (Pasteur Institute); Richard S. Lindzen (MIT); S. Fred Singer (SEPP); Andrew Collins (BBC Radio Times editor); Benny Peiser (Global Warming Policy Foundation); Gabriel (Gabe) Rychert (Climate Realists); Sally Allix; Angela Kelly; jo abbess; Mark Thompson (BBC Director General); Caroline Thompson (BBC); Anthony Bright-Paul (author); Tony Nicholls; Andrew Montford (Bishop Hill weblog); Humphrey Morison; David Bellamy (naturalist, conservationist); Sonja A. Boehmer-Christiansen (Hull University); Charles Wyndham; Colin Bradshaw (Rowan Studios); Piers Corbyn (Weather Action); Peter Sissons (ex-BBC); Professor Philip Stott; Hans Schreuder (Tech Know); David Evans (Science Speak); Fred Pearce (journalist, The Guardian, New Scientist Magazine); “CWS”; James Naughtie (BBC); John Humphrys (BBC); John Brignell (Number Watch); Kenneth (Ken) Haapala (SEPP); Rodney Leach (Matheson & Co.); “Physics Services”; Melanie Phillips (Daily Mail journalist); Andrew Revkin (New York Times journalist); The Tablet (Catholic newspaper); Andrew Tyrie (UK Parliament); Martin Rees (ex-President, Royal Society); Anthony Watts (Watts Up With That weblog)
Sent: Mon, Jan 31, 2011 4:50 pm
Subject: BBC 4
John
Don’t know if you’ve noticed, but Monckton is the star turn tonight from 2200-2300 hrs. There’s the usual weasel worded lead-in within the pages of the Radio Times as, indeed, there was for last week’s Horizon. It’s also interesting to see the BBC going into contortions not to abandon the party line – note, Horizon for warmistas was at peak time (2100 hrs), but this evening’s ‘off message’ contribution is slotted an hour ahead, when Corporation spin doctors no doubt expect that fewer people will access it, by then very sensibly preferring instead their mug of Horlicks and an electric blanket. The BBC will, of course, laud the exercise as a conspicuous example of its vaunted impartiality.
It is noteable too that JS in the RT, whoever that turkey may be, states that: “The film’s impossible task is to be rigorous enough to unpick his arguments without giving sceptics the impression that any criticism is just part of the conspiracy.” Climategate in mind, with this as just a Freudian slip? What say you?
Well, on this subject if not his Petri dishes, you, I and many another could unpick Sir Paul Nurse faster than a puppy could a bog roll.
With him and his cronies ’tis but a matter of being able to read ‘FRAUD’, writ large in neon lights. In the case of attempting to unpick Monckton, one might just have to undergo the inconvenient preliminary of actually acquiring a little knowledge.
Anyway, I’ll record it. It’ll not say anything that’s unfamiliar, but it will, nonetheless, do so effectively and well. Plainly, JS is bothered,
as well he might be, given the evidence of crass ignorance.
ATB
R
=x=x=x=x=x=x=x=x=x=x=x=x=x=x=
From: Christopher Monckton
Sent: 31 January 2011 19:52:46
To: Hans Schreuder (Tech Know), Rupert Wyndham (R. C. E. Wyndham, ex-Company Secretary, Sage Group), John Gahan (Farnham Geological Society, New Forest councillor)
Cc: John Gahan (Farnham Geological Society, New Forest councillor), Brice Bosnich (Australian National University, Research School of Chemistry);, Christopher Booker (Daily Telegraph columnist), James Delingpole (Daily Telegraph columnist), John Christy (University of Alabama in Huntsville), Nigel Lawson (Global Warming Policy Foundation), Paul Reiter (Pasteur Institute), Richard S. Lindzen (MIT), S. Fred Singer (SEPP), Andrew Collins (BBC Radio Times editor), Benny Peiser (Global Warming Policy Foundation), Gabriel (Gabe) Rychert (Climate Realists), Sally Allix, Angela Kelly, jo abbess, Mark Thompson (BBC Director General), Caroline Thompson (BBC), Anthony Bright-Paul (author), Tony Nicholls, Andrew Montford (Bishop Hill weblog), Humphrey Morison, David Bellamy (naturalist, conservationist), Sonja A. Boehmer-Christiansen (Hull University), Charles Wyndham, Colin Bradshaw (Rowan Studios), Piers Corbyn (Weather Action), Peter Sissons (ex-BBC), Professor Philip Stott, David Evans (Science Speak), Fred Pearce \n (Journalist, The Guardian, New Scientist Magazine), “CWS”, James Naughtie (BBC), John Humphrys (BBC), John Brignell (Number Watch), Kenneth (Ken) Haapala (SEPP), Rodney Leach (Matheson & Co.), “Physics Services”, Melanie Phillips (Daily Mail journalist), Andrew Revkin (New York Times journalist), The Tablet (Catholic newspaper), Andrew Tyrie (UK Parliament), Martin Rees (ex-President, Royal Society), Anthony Watts (Watts Up With That weblog)
There is a greenhouse effect; increases in greenhouse-gas concentrations add to it; CO2 is a greenhouse gas; at the quantum level it mimics the dipole moment of a more complex molecule; accordingly at its characteristic absorption wavelengths a quantum resonance is established in the molecule, radiating heat that would otherwise have passed harmlessly out into space; and, therefore, adding CO2 to the atmosphere, as we are doing, will cause some warming. It is trivially correct to say that the climate object’s only method of losing heat is by radiation to outer space: however, if some of that heat is retained in the atmosphere, radiating here via the quantum resonance in CO2 molecules rather than radiating harmlessly out to space, warming will of course result. I have already set out, in the simplest terms, the half-page of not particularly difficult undergrad physical math that establishes the fact and magnitude of the greenhouse effect in the whole atmosphere. I sent it to Siddons some time ago, but he remains unconvinced by what is proven mathematics.
The question, therefore, is not whether our adding CO2 to the atmosphere causes warming, but how much warming will result. This is the central scientific question in the “global warming” debate. Broadly speaking, climate scientists who address that question by measurement and observation tend to favor low climate sensitivity (i.e. not much warming); those who address it by modeling lean toward high climate sensitivity. My own most recent calculations, currently under peer review, suggest lowish climate sensitivity, with the IPCC having perhaps exaggerated it by double (this is a rather more cautious estimate of the exaggeration than that of many climate scientists). Remove even a twofold exaggeration and the climate “problem” vanishes. Where science is proven, one should adhere to it unless there is evidence that the proof is wrong. Like it or not, the fundamental equation of radiative transport, which establishes inter alia that there is a greenhouse effect, is long and definitively proven by reference to Planck’s blackbody law. Nothing from the Slaying the Sky Dragon book provides any serious or credible basis for challenging that proof. Until a serious case is made and submitted for review in the usual way, suggestions to the effect that there is no greenhouse effect are not likely to be taken seriously – and nor should they be.
The Viscount Monckton of Brenchley
—–Original Message—–
From: Hans Schreuder (Tech Know)
To: Rupert Wyndham (R. C. E. Wyndham, ex-Company Secretary, Sage Group); John Gahan (Farnham Geological Society, New Forest councillor)
Cc: John Gahan (Farnham Geological Society, New Forest councillor); Brice Bosnich (Australian National University, Research School of Chemistry); Christopher Booker (Daily Telegraph columnist); James Delingpole (Daily Telegraph columnist); Christopher Monckton (3rd Viscount of Brenchley); John Christy (University of Alabama in Huntsville); Nigel Lawson (Global Warming Policy Foundation); Paul Reiter (Pasteur Institute); Richard S. Lindzen (MIT); S. Fred Singer (SEPP); Andrew Collins (BBC Radio Times editor); Benny Peiser Benny Peiser (Global Warming Policy Foundation); Gabriel (Gabe) Rychert (Climate Realists); Sally Allix; Angela Kelly; jo abbess; Mark Thompson (BBC Director General); Caroline Thompson (BBC); Anthony Bright-Paul (author); Tony Nicholls; Andrew Montford (Bishop Hill weblog); Humphrey Morison; David Bellamy (naturalist, conservationist); Sonja A Boehmer-Christiansen (Hull University); Charles Wyndham; Colin Bradshaw (Rowan Studios); Piers Corbyn (Weather Action); Peter Sissons (ex-BBC); Professor Philip Stott; David Evans (Science Speak); Fred Pearce (journalist, The Guardian, New Scientist Magazine); “CWS”; James Naughtie (BBC); John Humphrys (BBC); John Brignell (Number Watch); Kenneth (Ken) Haapala (SEPP); Rodney Leach (Matheson & Co.); “Physics Services”; Melanie Phillips (Daily Mail journalist); Andrew Revkin (New York Times journalist); The Tablet (Catholic newspaper); Andrew Tyrie (UK Parliament); Martin Rees (ex-President, Royal Society); Anthony Watts (Watts Up With That weblog)
Oh Dear!
Even more luke-warmers will be borne from this man’s incorrect views of reality.
Has he read the latest papers on the extra cooling that is the only logical effect that can be ascribed to atmospheric carbon dioxide?
Is he aware yet that his beloved “climate forcing parameter” is a phantasma like phlogiston ever was?
He has all the formulae but they are meaningless if the computed parameter does not exist in reality.
When oh when will they learn to add one plus one and make two, not 2.2 or even 3 ….?
Little wonder than that this man is heralded by the BBC as the “voice of climate scepticism” – it suits them well as his arguments are easy pickings.
We’ve tried in vain to make him see where he goes wrong. States that the “only debate in town is the degree of warming” when the harsh reality is that no warming at all can come from adding carbon dioxide to our atmosphere.
Consider just these few words by Alan Siddons:
Surrounded by a vacuum, the earth has only one means of losing heat: by radiation. Gosh, could it be that radiating CO2 assists that process?
Ever considered that the vacuum of space has no temperature and is in fact the best possible insulator we could wish for? Earth does not need a blanket to keep it warm, never mind the electric blanket that the beloved “greenhouse effect” is concocted to deliver us.
Our atmosphere in toto always acts as a cooling mechanism and as a delaying cooling mechanism when the sun doesn’t shine on it.
We’d be a darn side warmer if we had no “greenhouse gases” to help radiate solar heat away into the vacuum of space.
Best regards,
Hans Schreuder
www.ilovemycarbondioxide.com
www.slayingtheskydragon.com
=x=x=x=x=x=x=x=x=x=x=x=x=x=x=x=
Image Credit : Ulla Norup Milbrath
Really, we can all relax.
We already have all the Renewable Energy technologies we need to power the whole world without a single molecule of carbon dioxide being pumped into the warming sky.
The wildcat growth in clean energy is exploding out of the record books, and we can reach and easily surpass our tough greenhouse targets, all by 2030.
https://news.cnet.com/8301-11128_3-20029784-54.html
The catch ? We do need to convince a number of key energy players to shift gear, and that may take a little effort and time.
There are also changes that can be useful demand-side as well as supply-side :-
We can do it if we adopt Engineering Development Goals :-
https://www.imeche.org/knowledge/themes/environment/Population

As an experiment with the notion of “common values”, I recently sat in a cinema with a bunch of my fellow citizens and inhaled the film “The King’s Speech”.
They laughed with the jokes (as in fact I did, right on cue), mourned with the pain (which gave me cause for reflection, too); and gave a huge round of applause at the end.
And you know what, I could have been swept along and joined them, apart from one observation.
The triumph of the central character over his physical disability, the applause he received, both at the time and in the cinema, this was all whilst giving a message that the country was about to commence widescale violence towards another country – the declaration of war.
Everybody was cheering for war. I couldn’t join in.
It is to the good memory of David Fleming that I recommend you read his last published work, co-written with Transition Towns’ Shaun Chamberlin, “Tradable Energy Quotas : A Policy Framework for Peak Oil and Climate Change” :-
Amidst all the psycho-sociological arguments being waged by political theorists and campaigny people about changing peoples’ values, and whether that’s right/useful or not, one plain fact should emerge like a tree to clutch in a flash flood – people respond to rules.
If the rules of the game are that we should reduce our carbon dioxide emissions by 80% by 2050, and everybody, including the energy production companies, are required to play a significant role, this fact alone establishes “common cause” and creates a framework for action.
Although the Climate Change Act is the law – a piece of legislation – it has yet to be fleshed out. Until it becomes clear what the exact policies, measures and instruments will be, agreed and implemented, there will continue to be massive amounts of flailing and flapping about, scepticism, recalcitrance, dogma and complaining.
When it becomes clear what the framework for the energy industry, big business and social provision will be, then people will knuckle down and accept the inevitable.
I’m not arguing for eco-fascism – far from it. Mistakes in policy are all too possible, and so strong engagement is required, far beyond the token democracy we are currently permitted to take part in. Taking part in a government consultation on energy and carbon emissions is about as effective as waving a placard in the direction of Downing Street, except you don’t run the risk of getting arrested for it.
The only thing the public are currently permitted to do is cut their own domestic emissions. They’re not allowed to have a say about what business or government do about emissions.
Yet despite this complete absence of public involvement, there are signs of progress. Once we have managed to fight our way through the windstorm of nonsensical technological “fixes” that are worse than useless; once we have some educated people in the Government and the Civil Service – education on matters of engineering rather than humanities; then we can start to see sense from the top.
Urgent request from the floor : please can the Government and industry please stop alienating people with calls for consumers to change their behaviour. It’s producing resistance, and that is a threat to progress on reducing emissions.
What do I think about changing values ? I don’t believe “we” should try to change values or behaviour. That amounts to manipulation in my view.

Revealing the Global Warming Signal
Jo Abbess
06 January 2011
1. The statistical meaninglessness of the global average temperature
Analysis of datasets of Earth surface temperatures from instrumental records and reconstructions from proxies should take into account vital metadata, measured knowledge about cyclic influences, annotations of overall climatic regimes and unique short-term events, that can enable informed analysis. “The climate system…has multiple components with physically distinct characteristics…basic physical considerations argue strongly against the notion that the global average surface temperature has a single characteristic time scale, or time constant.” (Foster et al., 2008). Discussion of uncontextualised curves can be counter-productive (BBC, 2010), as the appliance of inferential statistics and other numerical techniques has been contested as inappropriate (Kelly and Jones, 1996; Mann et al. 1998; Rahmstorf, 2006; von Storch et al., 2004, Wahl et al. 2006), given that variables forcing the thermal response of the climate cannot be assumed to behave in a Gaussian probabilistic fashion, be unmodulating over time, be independent of each other or be guaranteed to have linear effects. Much is now known about internal cyclic variability, and unrepeatable influences such as random volcanicity, the time parabola of industrial aerosol ejection, major fire seasons and the profiles of short-lived “climate shift” re-organisations (Miller et al., 1994), so it can be claimed that the climate system is no longer a black box, and should not be mathematically treated as such. A reasonable axiomatic assertion can be made that the rapid accumulation of greenhouse gases in the atmosphere is causing a regular time-varying response, but that this can only be revealed by systematically deducting the impact of other well-studied signals. As the climate system is composed of ongoing and random events, and suffers episodes of localised non-linearity, with suggestions of chaotic bifurcation thresholds and hints of multiple stable states, this is not facile. The development of a standardised “resolved” global temperature dataset with less noise would be a useful communication tool. Published and tracked over time, it could give a clear visual signal of whether the thermal response is departing from the projected pathway – a useful policy tool. The detection and attribution of global warming using datasets of real world observations that are filtered for known effects is a valuable exercise that corroborates modelling of the radiative forcing on the climate system. One representative study of this kind has resolved the underlying global warming trend as continuously and consistently rising. “Global-mean surface temperature is affected by both natural variability and anthropogenic forcing…identifying and removing from global-mean temperatures the signatures of natural climate variability over the period January 1900 [to] March 2009…filtered from the record, the residual time series reveals a nearly monotonic global warming pattern since [about] 1950.” (Thompson et al., 2009).
As part of a fully comprehensive method, in order to be confident that millenial-, age- or even epoch-scale changes are not influencing current temperature evolution, it is first necessary to consider our place in geological time by summarising the outcomes of paleoclimatological research. Then, it is necessary to consider all the lines of evidence that parametrise modern era climatic influences, developing indices (indexes) of their magnitude and duration, enabling their effects to be deducted from the total at all points, to reveal the underlying global warming signal. It is also necessary to isolate and remove errors in instrumentation, which may result from changes in instrument choice or method, or bias owing to the distribution of measurements, or other features of data collection. Only when the residual anomalies are revealed is it appropriate to discuss statistical analysis of the radiative forcing of global temperatures.
2. Our place in geological time

2.1 The 6 billion year time scale
This time period includes the accretion of the Earth. The carbon dioxide concentration in the Earth’s early atmosphere was very high, and this was only significantly reduced and replaced with atmospheric oxygen when life forms emerged that respired oxygen, and minerals became oxygen-saturated, starting some time after 2.5 billion years ago (Anbar et al., 2007; Bolin et al., 1979). Evidence suggesting the sequestration of carbon dioxide by the “biological pump” and weathering can be seen in the “descending stairway” glacial periods of the Vostok ice core record of the last 800,000 years (Jouzel et al., 2007). Aside from periodic interglacials, major volcanism and extinction events (Ward, 2006), the tendency has been towards less carbon dioxide in the atmosphere, and less greenhouse effect on global temperatures.
Current trend of surface temperatures on this timescale : gradual cooling.
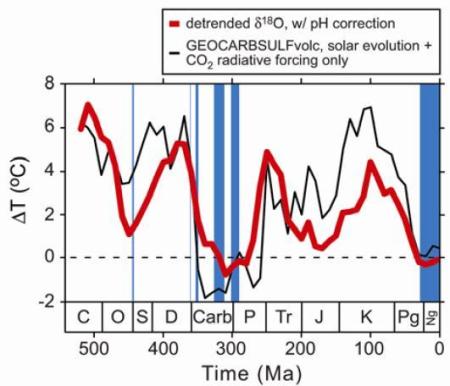
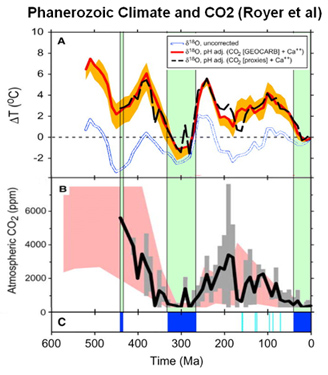
2.2 The 500 million year timescale (Phanerozoic)
The GEOCARB III project and other research into deep time proxies from the emergence of multicellular life, show that over the last 500 million years the Earth has cycled between an “ice house” and a “greenhouse”, and that we are currently experiencing the low point of a Great Ice Age, with significant glaciation of the polar regions (Royer et al., 2004). Evidence from the previous cold state, the “Permo-Carboniferous”, which had a similar continental layout on the Earth’s surface as today, and could be analogous, shows continued glaciation for around 50 million years. The current Quaternary “ice house” has been running for less than 50 million years and so could be expected to continue.
Current trend of surface temperatures on this timescale : overall cooling since around 250 million years ago (Royer et al., 2004, Figure 4), and currently stable in the low temperature range.

2.3 The 65 million year timescale
The permanent glaciation of Antarctica occurred around 34 million years ago (DeConto and Pollard, 2003, Figure 2c). Commencement of episodic glaciation of the Northern Hemisphere is thought to have been possible since around 25 million years ago (DeConto et al., 2008), and extensive glaciation of the North Pole region occurred around 3 million years ago (Lunt et al., 2008). There is evidence of several major spikes and optima in temperature including the Palaeocene–Eocene Thermal Maximum (PETM) at 55 million years ago (Bloom, 2010; Zachos et al. 2008 Figure 2). These have been attributed to various external forcings such as large volcanic or mantle plume emissions of carbon dioxide and methane from the Earth’s interior, or changes in the deep ocean currents or sea level, causing the sudden release of methane from subsea hydrate provinces (Davy et al., 2010; Bice and Marotzke, 2002). Overall, however, the general trend has been a reduction in temperatures.
Current trend of surface temperatures on this timescale : generally falling.

2.4 The 5 million year timescale
This timescale features climate cycles that change in phase from shorter to longer over the period (Lisiecki and Raymo, 2005, Figure 4, LR04 oxygen 18 isotope proxy for average global ocean temperature). Whilst the most recent cycle peaks are roughly as warm as those at the start of the period, the cycle troughs are cooler. There was near monotonic cooling of the envelope over this timeframe, not perturbed by the onset of permanent Northern Hemisphere glaciation.
Current trend of surface temperatures in this timescale : cooling.

2.5 The 1 million year timescale
Ice cores range back to around 800,000 years, revealing the onset of 9 interglacials (Luthi et al., 2008, Figure 2). Each interglacial period shows relatively sharp warming over a period of several thousands of years, followed by a slow decline in temperatures over the next tens of thousands of years, until conditions cross a threshold and a glacial period begins. Each glacial period is punctuated by multiple relatively rapid and short-lived warmings (interstadials), which are thought to portray roughly 1,470 year cycles of Dansgaard-Oeschger events in Bond cycles, interspersed with Heinrich events (Alley, 2000b, Figure 12.4; Bond and Lotti, 1995; Bond et al., 1997; Bond et al., 2001; Debret et al., 2007; Fluckiger et al, 2006; McInnes, 2008).
The last glacial period began around 116,000 years ago, and terminated around 11,000 to 12,000 years ago, and had around 25 Dansgaard-Oeschger cycles in that period (NGRIP, 2004, Figure 4). The current interglacial, which began roughly 12,000 years ago appears to be more uniform than previous interglacial periods, and has shown a gradual decline in overall temperatures, as do previous interglacial periods.
Current trend of surface temperatures in this timescale : cooling.


2.6 The 20,000 year timescale
The Earth’s climate experienced its Last Glacial Maximum at around 20,000 years ago, with deglaciation tracking the solar forcing (Clark et al., 2009) into the cooler Older Dryas period (that included Heinrich Event H1) starting 18,000 years ago (Shakun and Carlson, 2010). Bolling-Allerod warming starting around 14,500 years ago (Liu et al., 2009), followed by the sharp Northern Hemisphere-focussed cooling of the Younger Dryas period at 12,900 years ago (Broecker, 2006; Murton et al., 2010), and a sharp warming again at around 11,700 years ago (Steffensen et al. 2008, Figure 2), the Termination 1 that heralded the Holocene era. This start to the current interglacial has been compared to Termination 5 which had a similar start-stop-start (“AMOC hysterisis” – Liu et al., 2009) behaviour (Marine Isotope Stage 11 (MIS 11)).
Since the start of the current interglacial period beginning at Termination 1, there have been several cooler periods (stadials), including what is termed the 8.2 kiloyear event (Carlson et al., 2009). The current interglacial period has been characterised by several periods of slightly warmer temperatures, at both millenial and centennial scales, but for the past 6,000 years, temperatures have generally been on the decline. The current interglacial period is expected to last for some time longer – 50,000 years (Berger and Loutre, 2002).
Current trend of surface temperatures in this timescale : cooling.

2.7 The last 8,000 years
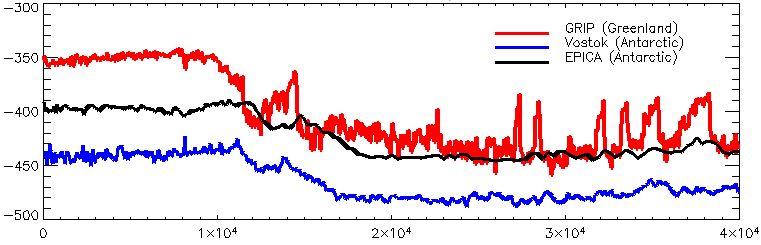
Within the 8,000 year timescale, there were several significant cooling and warming events identifiable in the Arctic region of the of Late Holocene, under an overall cooling arc, according to data available from the Greenland Ice Sheet Project (GISP 2) (Figure 1). Since approximately 3,500 years BP but prior to the 20th Century, there were four warmer than average centennial-scale periods, with successively lower peaks (Figure 2). Over the 8,000 year timeframe there were approximately 10 cooling-warming cycles, with most periodicities between 500 and 800 years (Kaufman, 2009; Turney, 2005, Figure 5 for one proxy). These are variously considered to be driven by solar cycles (Jiang et al., 2005; Ogurtsov, 2010) or oceanic seesawing (Barker et al., 2009; Maslin et al., 2001; Maslin and Smart, 2009; Seidov et al., 2001; Severinghaus, 2009; Stocker and Johnsen, 2003; Swingedouw et al., 2008). Northern Hemisphere temperatures as a whole do not show the same signature of the Greenland variations in reconstructions (Christiansen and Ljungqvist 2010; Jones and Mann, 2004; Ljungqvist, 2010; Mann et al., 2008, Seppa et al., 2009), and so the underlying causes of Greenland temperature cyclicity cannot be invoked to explain anomalous global warmth in the 20th and 21st Centuries.
Temperatures in Antarctica were more stable, reflecting its climatic isolation, and experienced an overall cooling arc from about 6,000 years BP, having recovered from the 8.2 kiloyear cooling event, which shows a correlate in the Northern Hemisphere record, and can therefore be taken as global in scope. The ice core from EPICA Community at Dronning Maud Land in Antarctica published in 2006 (EDML) shows this clearly (Figure 5), and the EPICA Dome C data also indicates a similar shift (Figure 4). Studies of solar forcing suggest that the cooling trend could continue for another 23,000 years (Imbrie and Imbrie, 1980).
Current trend of surface temperatures on this timescale : cooling.

2.8 The 150 year timeframe
This has been the period of the instrumental record, and has shown rapid warming consistently throughout, which appears to be unprecedented. Although there is evidence of abrupt climate change in recent millenia, these events appear to have been generally sub-decadal, probably associated with changes in oceanic circulation that seem to cross some threshold (Alley, 2003; Alley, 2007; Bond et al., 1999; Broecker, 1997; Broecker, 1999), concentrated (at commencement) or localised in a particular region (Grachev and Severinghaus, 2004; Kobashi et al., 2008; Murton et al. 2010), and if there was a warming, a cooling generally came first (Steffensen et al., 2008). The last 150 years do not resemble this scenario. There appears to have been a departure from cooling trends at around 1880 (indicators point to a range between 1850 to 1910) AD, and a decadal rate of warming that appears significant on a centennial timescale.
Ocean waters in the Arctic and North Atlantic have recently been freshening (Peterson et al., 2006), but it is uncertain if this threatens a collapse of the North Atlantic Meridional Overturning Circulation (AMOC) (Bryden et al., 2005; Garzoli et al., 2010 Section 5 “Fresh Water Balance”, Holmes et al., 2010, Page 2). It seems that the Atlantic circulation has changed its pattern since the advent of the Holocene era (Negre et al., 2010), so may not be subject to the same kind of abrupt climate changes as previously, although this doesn’t rule out rapid swings in future (Alley et al., 2003; Gregory et al., 2005; Lisiecki et al., 2008).
Temporally microfine “abrupt” salinity and temperature anomaly events in the Arctic relate to the natural internal variation of the Northern Atlantic Oscillation (Golubeva and Platov, 2009; Golubeva, 2010; Sundby and Drinkwater 2007), fresh water-induced, “cropped” quasi-Heinrich surges (Ziegler, 2009, pages 16, 98), which may be able to compensate for some of the land surface global warming anomaly by hemispheric oceanic thermal reorganisation (Thompson et al., 2010, Figure 1 “NH – SH”), “pumping” in phased steps driven by threshold conditions, but this periodic “negative feedback” has not interrupted the overall climb in global temperatures (Hansen et al., 2010).
Current trend of surface temperatures on this timescale : warming.
3. Current climatological influences
The current trend for surface temperatures is warming. The principal theory to explain this is additional Greenhouse Effect from mankind’s activities – the Theory of Anthropogenic Global Warming. The IPCC’s Fourth Assessment Report confirms that the core elements of this theory are robust (IPCC, 2007c, Section TS.6 “Robust findings”). Although the theory has been verified in many respects, there are also clear uncertainties, particularly in the area of the Earth’s transient and equilibrium climate change response. The key question is whether the Earth, in responding to the global warming signal, can re-adjust its climate, via a set of negative (dampening) feedbacks, leading to little or no overall temperature change.
3.1 The Burden of Proof
In order to provide evidence of a causative relationship between mankind’s disturbance of the Global Carbon Cycle and putative global warming, certain things have had to be established :-
3.1.1 That the near surface atmosphere and upper ocean temperatures on Earth have been rising.
3.1.2 That so-called Greenhouse Gases cause the Greenhouse Effect, and that increasing Greenhouse Gas concentrations in the atmosphere can cause added Greenhouse Effect.
3.1.3 That concentrations of Greenhouse Gases in the atmosphere are rising.
3.1.4 That mankind’s activities are responsible for increasing levels of Greenhouse Gases in the atmosphere (“fingerprinting” from detection and attribution studies).
3.1.5 That there are no tertiary factors that could be causing any similar magnitude of observed global warming.
3.1.6 That there are no cyclic internal variations in the Earth system that could account for any similar temporary or sustained magnitude of observed global warming.
3.1.7 That the data are accurate.
3.1.8 That climate change (in response to global warming) is not causing negative feedbacks to counteract global warming.
3.1.9 That changes in the Global Carbon Cycle (in response to global warming) do not counteract global warming.
3.2 The Evidence
3.2.1 Global Warming is happening
Robust findings from the IPCC Fourth Assessment Report Working Group 1 established a consensus on the evidence of global warming (IPCC, 2007c, Section TS6.2.1). More detailed understanding continues to be developed, such as the effect of stratospheric water vapour on tropospheric temperatures (Solomon et al., 2010), the irreversibility of warming because of ocean heat content (Solomon et al., 2009); confirmation of strong and continuing ocean heat content (Domingues et al., 2008; Ishii and Kimoto, 2009; Levitus et al., 2009; Lyman et al., 2010) and the string of warming records being broken in the major data sets (including NASA GISS (including “Warm Stations”), NOAA NCDC, Met Office HadCRUT3, RSS and UAH).
Measures have been taken to address the lack of temperature records and proxy temperature data in the Southern Hemisphere, such as the deployment of the ARGO network of ocean monitoring buoys. However the paucity of Southern Hemisphere data does not significantly alter the conclusion that this half of the Earth’s surface is also warming, in step although not in gradient, with the Northern Hemisphere (NASA GISS, 2010).
Differences between the major temperature records have been potentially ascribed to either the way that data is collectively treated and summarised (gridded) or differences in how temperatures are interpolated in the Arctic region from sparse monitoring. Despite this ongoing discussion, it is clear that all the major sources of data show synchronous regional and overall global warming of similar magnitude.
3.2.2 Greenhouse Gases cause the Greenhouse Effect
That Greenhouse Gases can absorb sunlight and re-radiate infrared (the “warming” part of the electromagnetic spectrum) is science that is roughly 150 old (Arrhenius, 1896). It’s basic Physics. Barring some entirely new postulated quantum effect from a particular species of gas or particulate matter found to form part of the atmosphere, or some previously undiscovered property of the Oceans or the solid matter that forms the Earth’s crust, it can be safely asserted that molecular gases with asymmetrical oscillatory modes are the cause of the Greenhouse Effect, keeping the Earth’s surface warmer by around 30 degrees Celsius (IPCC, 2007e, p. 97) than it would be without an atmosphere; as they have a warming effect on their surroundings in the presence of sunlight, through their behaviour in relation to electromagnetic radiation.
3.2.3 Greenhouse Gas Concentrations rising in the atmosphere
The data work on atmospheric species (NOAA, 2010) confirms unambiguously that concentrations of carbon dioxide and other Greenhouse Gases are rising in the Earth’s atmosphere. Methane concentration growth slowed (IPCC, 2007a, p. 7 (135) ), but since 2007 growth in its atmospheric concentration has restarted (Rigby et al., 2008). The oxidation of methane (Boucher et al. 2009) has likely led to an increase in stratospheric water vapour (IPCC, 2007a, p. 24 (152); Myhre et al., 2007). Ozone levels in the troposphere respond to methane concentrations (Fiore et al., 2008), and have also been rising (IPCC, 2007a, p. 3 (131) ). Modifications to the Montreal Protocol contributed to restraining growth in halocarbons, chemistry with high Global Warming Potential.
3.2.4 Fingerprinting Humankind
In detection and attribution studies, progress has been made in clearly “fingerprinting” humankind’s activities as the cause of rising concentrations of atmospheric Greenhouse Gases. The work on the ratios of carbon isotope species has shown that fossil fuel-derived carbon is increasing in the atmosphere. When fossil fuels are burned, they oxidate, and a clear signal of oxygen depletion in the atmosphere has been detected (IPCC, 2007a, Figure 2.3), which outstrips possible effects from deforestation, or the any mass death of photosynthetic life on land, or in the oceans, due to acidification from increased atmospheric carbon dioxide.
3.2.5 Significant External Forcings
In any empirical research that seeks establish the cause or causes of an effect, it is always necessary to consider tertiary factors to the hypothesis – other possible causes that may better explain the outcome. Also, it is necessary to consider indirect causation – that there is a precursor, a factor that causes the cause being considered.
Some influences on temperature in the Earth system are considered to be “external” to the normal climate cycles, and some as inherent “internal” variation (see further down).
3.2.5.1 Radiative Forcing
As a measure of the warming effect at the Earth’s surface, radiative forcing is more “readily calculable” (IPCC, 2007a, p. 5 (133) ) than overall climate sensitivity. The “forces for warming” arise from the composition of the atmosphere, influences from the chemical species, chemical reactions and airborne particulate matter (aerosols) such as dust and ash (Lohmann et al. 2010). There is discussion about whether some effects should be considered feedbacks or primary forcings (IPCC, 2007a, p. 153). There are also complex discussions about the sign of the influence, whether warming or cooling, at different heights in the atmosphere and various regional locations (Alterskaer et al., 2010). One of thorniest issues appears to be whether the forcings should be calculated in a way that discounts (Alterskjaer, 2010) or accounts (Hansen et al., 2005) for the short-term stratospheric response.
There is much agreement that the rapid increase in carbon dioxide in the atmosphere acts as a pulse, an almost instantaneous (in geological timescales) compositional change in the atmosphere and is modelled as such (IPCC, 2007d). There are still some areas of “low” scientific understanding (IPCC, 2007a, Executive Summary), but aside from studies on clouds, these are for chemistry where influence on warming is anticipated to be minor.
One key area of study is the various effects of industrial aerosols, particulate matter and chemical species produced by humankind’s activities such as burning fossil fuels for transport, electricity generation and manufacturing; which go on to reside and react at various regions and levels of the atmosphere (Hansen et al., 2005, p. 35), with various warming or cooling impacts. An example is the direct aerosol effect, the scattering and absorption of incoming solar electromagnetic radiation by airborne particulate matter. Scattering leads to less sunlight reaching the surface of the Earth, and is the key factor in what has been named “Global Dimming”, an effect that has protected the Earth from some global warming (Ramanathan and Feng, 2009). Dust has apparently been identified as a coolant (Mahowald et al., 2010), or has a mixed effect (Kok, 2010). The differences in the temperature records of the Northern and Southern Hemisphere can be partly explained by such studies.
High levels of aerosol in both the stratosphere and the troposphere are the major factors in the net negative radiative forcing at the surface of the Earth (IPCC, 2007a, p. 132, Executive Summary, p. 208, Section 2.9.5), however, the evidence is that Earth is as a whole still warming (IPCC, 2007b, Sections 3.2, 3.8), perhaps exponentially (IPCC, 2007b, Tables 3.2 and 3.3), which must be attributable to the tropospheric radiative forcings summing to a positive, warming value (IPCC, 2007a, p. 205, Section 2.9.2).
If the atmosphere, and the oceans, with which it interacts, were not in constant motion, and if the climate response didn’t include some additional warming (cooling) as positive (negative) feedback, the radiative forcing calculations could lead to straight-forward projections of global warming, but the real world is more complicated than just considering a simple well-mixed atmosphere in stasis on a non-rotating Earth. However, radiative forcing of atmospheric components, expressed in Watts per square metre, helps tease out the relative strength of various unknowns, such as the correct magnitude and sign of the warming influence of solar irradiance change in various parts of the electromagnetic radiation spectrum (Hansen et al., 2005 paragraph 8; Haigh et al., 2010).
3.2.5.2 Volcanic Eruptions
The Mount Pinatubo volcanic eruption in June 1991 afforded a prime opportunity to study the effects of volcanic aerosols in the atmosphere. The analysis showed an intense, but short-lived (less than 5 years), global cooling effect (IPCC, 2007a, pp. 132, 137, 142, 193). Regular volcanic activity does emit carbon dioxide (and methane too by disruption of sequestrated fossilised organic matter) into the atmosphere from the Earth’s crust (Hards, 2005), but measurements of carbon dioxide levels after eruptions do not show any great rise in atmospheric concentrations (NOAA, 2010). So, recent global warming cannot be attributed to volcanism.
3.2.5.3 Solar Irradiance Change
Obviously, the Sun is the primary cause of keeping the Earth’s surface warm, but the rate of recent rise in Earth’s surface temperature does not correlate significantly with changes in solar irradiance output (Lockwood and Frohlich, 2008). Changes in solar activity are considered to account for a small proportion of measured global warming over the last 100 years, but their contribution to global warming of the past 20 – 50 years is vanishing (Ammann et al., 2007; Duffy et al., 2009; Meehl et al., 2004, Lean, 2010; Lockwood, 2010). Solar side-effects such as the solar wind, and its effects on cosmic rays, and their purported effects on the atmosphere and its clouds have not been shown to have any significant effect (Skeptical Science, 2010). There is strong evidence from paleoclimatology that change in solar insolation due to the precession and tilt of the Earth’s axis, and its orbital progression around the Sun have strongly influenced climate cycles in the deep past (see Section 2). But then, as now, change in solar output and insolation have been cyclic or periodic, with quasi-sinusoidal change, whereas current global warming appears to be exponential and unidirectional. Episodic alterations in the spectral distribution of solar output during its short-term 11-year cycles may play a part in variations of the temperature of the near-surface Earth (Haigh et al., 2010), but again, these would be expected to crest and dip on the whole, whereas current global warming appears to be a sustained positive phase change.
3.2.5.4 Land Use Change
Deforestation is said to account for something in the region of 15% of net anthropogenic Greenhouse Gas emissions to air (van der Werf et al., 2009), and so, although it will have long-term, possibly permanent, effects on Earth’s climate, it cannot account for the bulk of recent warming. Nitrous Oxide is a Greenhouse Gas whose rising emissions are attributable to changes in agriculture (IPCC, 2007a), but it has only roughly a third of the effect of methane (IPCC, 2007a, Fig 2.21). Soil erosion and desiccation from agricultural intensification has led to a breakdown in the carbon cycle – less carbon dioxide is sequestered in soils, but the scale of emissions increase cannot account for the levels of warming being measured.
Widescale deforestation and the development of agriculture have been suggested to explain the extremely unusual and stable nature of the Holocene era (Ruddiman et al., 2010), in that the temperatures have not reduced rapidly after the warming spike at the end of the Last Glacial Maximum as they did in previous glacial Terminations, as seen in the ice core records (see Section 2). Global warming has reversed the general cooling trend of the last 6,000 years in the last 150 years or so, which just happens to coincide with vast increases in agricultural production and the exploitation of timber, aided by the use of fossil fuels for energy; but the fossil fuel emissions are by far the largest factor.
3.2.5.5 Rapid warming – alternative mechanisms
There have been several alternative mechanisms proposed for periods of rapid global warming in Earth history, one of which being the mass emission of carbon dioxide and methane during the collision of tectonic plates, triggering ocean anoxia and emissions of warming hydrogen sulphide and mass extinction (Ward, 2006). While there is evidence of anoxic events taking place currently, these seem to be associated with run-off from agricultural and toxic waste into the oceans. There is no evidence of the “ocean conveyor belt” (Lozier, 2010) undergoing major alterations which could allow explanations of large quantities of heat or methane being released to the atmosphere from ocean depths. Although there is evidence of rising methane concentrations in the atmosphere, and methane emissions are causing concern in the melting permafrost and tundra of the Arctic region, these are considered to be an effect of global warming rather than a cause, unlike ancient events (see Section 2).
The current warming can be attributed with high levels of confidence to radiative forcing. Confirmation comes from a wide variety of sources, for example, consideration of the Diurnal Temperature Range, stratospheric cooling, hemispheric and zonal differences in warming, and analysis of extremes and frequencies of extremes in weather.
3.2.6 Significant Internal Variability
The magnitude of the swings in internal variability in the climate can sometimes overwhelm the signal from global warming. However, variability cannot be equated with a trend. The aim of studies into variation must be to establish whether the changes are a result of global warming, or a cause. Here, the most significant internal variability factors are considered.
3.2.6.1 Oscillations – Climate Cycles
The air pressure oscillations and their climatic teleconnections are a significant feature of the Earth system, and it is important to be clear that recent global warming is not merely an upswing in one or more of these climate cycles. There is evidence of multi-decadal waves patterns, but oscillations would need to have a centennial-scale long cycle, or longer, to explain the current warming period.
When analysing climate oscillations it is important not to be misled by anomalies in the data series, which may be due to unrelated factors, or even instrument errors (see “Data Correction” section below). For example, the cooling phase between the late 1960s and early 1970s has been associated with a “Great Salinity Anomaly” in the North Atlantic – which could have been caused by meltdown in the polar region (Peterson et al., 2006, Figure 4; Thompson et al., 2010). Ongoing changes in Arctic precipitation and ice pack could be responsible for future short-term cooling episodes (Dickson et al., 2000, Figure 7; Miller et al., 2010, p. 21 (1699); NSIDC, 2008; Seo et al., 2010).
There is evidence of change in the climate oscillations as measured by their indices over timescales of decades – the patterns of the anomalies have changed as well as the trends (Hurrell et al, 2003, NCAR, 2010; NOAA Data, 2010). This suggests the climate oscillations are being altered by global warming.
There is an inherent problem in trying to assess the indices of the oscillations, as the “base” period on which the calculations of anomalies in the wave patterns are made may not represent a time of stability, as is suggested by the indices datasets themselves (Hurrell and Deser, 2009; NCAR, 2010). The mean of a moving target may not represent a suitable measure from which to judge movement overall.
The underlying trends for oscillations seen in the 1980s to 1990s have not persisted (Osborn, 2010), so some multi-decadal cyclicity could be a component of what is happening, or other factors may be coming into play, such as one-way-only threshold-reliant readjustment of the vertical layers of the atmosphere, or the transport between ocean basins. The evolution of the ENSO could corroborate this (Ashok et al., 2007).
Transformation arithmetic is used to calculate the “normal” patterns of oscillation in the climate of the ocean basins (Empirical Orthogonal Functions (EOF) or Principal Components Analysis (PCA)), and the reported indices are therefore modulation anomalies from these “carrier” wave patterns. However, if the basic modality of the oscillations are themselves subject to change, the approach breaks down at the first assumption (Kellie-Smith, 2010, 4.5 “Conclusion”). New ways to subtract the ENSO signal from global temperatures are being developed (Chen et al., 2008a, p. 5 “contaminates”, Chen et al. 2008b).
At present there is no contender for an oscillation that correlates either its positive or negative phase index, or both, with the global warming trend. A case in point is the Arctic Oscillation (AO), which showed a positive trend in its index throughout several decades, and suggested a correlation with global warming, but has now gone into a severe negative phase, even as 2010 is expected to be the warmest year in the instrumental record.
Combining the indices of the oscillations does not show a general trend, as they are all, to some extent, co-varying with time lags, which would tend to cancel them out. However, the ENSO oscillation, and polar modes including the North Atlantic Oscillation (NAO) seem to lead or greatly influence the others, and could be considered real internal variation.
3.2.6.2 Circulations
There has been some evidence that the ocean circulation patterns are changing in response to global warming (Sherwood et al., 2011; Williams and Grottoli, 2010). However, although highly variable, the strength of the Atlantic Meridional Overturning Circulation (AMOC) does not appear to be suffering significant reduction (RAPID-WATCH, 2010).
As regards air mass circulation, coincident with unusually low indices in the Arctic Oscillation (AO) in recent years, displacement of the jet streams have been implicated in “blocking” events, preventing the usual waves of propagation of anti-cyclones in the Northern Hemisphere (see “Mixed Layers” section below; WMO, 2010). Impacts cited in the popular press included the severe winter of 2009/2010, the extreme heat in Russia in summer 2010 and catastrophic flooding in Pakistan in the same season (Woollings et al., 2010). The IPCC Fourth Assessment states that blocking is trending in step with global warming, but only in the North Pacific in connection with La Nina (IPCC, 2007b, Section 3.5.4 “Blocking”). Recent events suggest it could become more general.
3.2.6.3 Mixed Layers
There is evidence that the tropopause has changed its height (Santer et al., 2003; Schmidt et al., 2008), most likely as a result of global warming, and clearly has implications for planetary waves at the troposphere-stratosphere boundary, jet streams and the annular modes of oscillation at the poles (IPCC, 2007b, Section 3.5.6).
The mixed layer between the atmosphere and the ocean has been showing the effects of ocean warming (Domingues, 2008), and the intensity of tropical hurricanes and other storms near the Equator has been shown to have increased owing to higher sea surface temperatures (Elsner et al. 2008).
These changes all have implications for the near-Earth surface temperatures, but it is determined that they are feedbacks, not causes.
3.2.7 Data Correction
Problems with global temperature data sets relate to a number of issues, including changes in technology, instrument bias and alteration in human systems of data collection. Anyone attempting to perform statistical modelling of climate systems based on the data sets will need to first iron out the data wrinkles, or else their analysis risks being unsound. One example is that of an apparent abrupt dip in sea surface temperatures in the period between 1940 and 1950, which it turns out can be explained as a data problem (Thompson et al., 2008). By using a simple arithmetic technique of subtracting oscillation anomalies (indices) and other well-known factors from the overall temperature records, it has been shown that the effect can be attributed to more measurements being done with one method than another. Another example of data correction is when Dr John Christy and Dr Roy Spencer famously had to retract claims regarding global warming when it was discovered that there were bias errors in satellite monitoring data, when in fact there are no significant difference between the major data sets when adjusted (Thorne et al., 2010).
3.2.8 Climate Feedbacks
There is ongoing research into cooling (negative) feedbacks in the climate system, and whether they could constrain the warming effect of increased concentrations of atmospheric greenhouse gases. If these effects are temporary, they could only offer a short-term reprieve. There has been much discussion around the “fertilisation effect” of increased atmospheric carbon dioxide, and evidence has been found to support that (Lewis et al., 2009), although this could be overwhelmed by future climate changes, including in rainfall patterns and drought (Dai, 2010).
There is some suggestion that global warming, since it leads to a higher level of water vapour sustainable in the atmosphere, could lead to enhanced cloud cover of forms that show increased cooling albedo – as long as this compensates for their added Greenhouse Effect. There remain considerable uncertainties about the role of clouds under current conditions of sharp global warming (IPCC, 2007c, Section TS6.2.1; IPCC, 2007b, Section 3 3.4).
Most feedbacks are found to be positive (warming), enhancing and amplifying global warming. The sensitivity of the climate – the exact level of the full-term warming response to the changes in atmospheric composition – remains uncertain, but is known to be significant (IPCC, 2007d).
3.2.9 Carbon Cycle Feedbacks and consideration of Paleo-Analogies
Given that Anthropogenic Global Warming, as proposed, would disturb the Global Carbon Cycle, possible responses have been assessed to see if they could counteract the warming by increasing the carbon pump or carbon sink effect.
3.2.9.1 Evidence of current Global Carbon Cycle change
There are uncertainties in how the Carbon Cycle will respond (IPCC, 2007f, Section 7.3; IPCC, 2007d, Section 10.4). There are some indications that the “biological pump” of the ocean that draws carbon dioxide down from the atmosphere may be compromised (Boyce et al., 2010). However, it is also possible that for now, the oceans and land plants (although not the soils, perhaps) are taking up the same fraction of carbon dioxide from the atmosphere as ever, meaning more carbon dioxide poached from the air in total (Knorr, 2009; Sarmiento and Gruber, 2002, Figure 3). These changes are best explained as being caused by global warming. Changes in the slow geological sequestration components of the Carbon Cycle are probably not measurable.
3.2.9.2 Paleo-Analogies
It is instructive to look back into the deep past to try to establish how the Global Carbon Cycle initially adjusted to, and then re-adjusted atmospheric carbon dioxide levels. These include the sharp warming occurred at the boundary of the Paleocene and Eocene geological eras (PETM) (Kopp et al., 2007), the mid-Eocene (Bijl et al., 2010), Termination V, MIS 11 (Bowen, 2010) and the mid-Pliocene (Ravelo et al., 2009). None of the periods so far considered can be a perfect analogy, because unfolding conditions are highly anomalous, including a very high rate of atmospheric carbon dioxide accumulation.
4. Conclusions
Recent global warming is a real effect (Thorne et al., 2010), and the only significant correlating relationship is with anthropogenic alteration of the atmosphere, as none of the alternative hypotheses could provide the magnitude or signature of the changes observed. The net emissions to air of greenhouse gases from anthropogenic sources, the side-effects of which include the ejection of aerosols, are altering the net radiative forcing. Having established confidently this is the reason for sustained and increasing global warming, it becomes justifiable to deduct the effects of internal variability and episodic external forcings such as volcanic eruptions from the temperature record in order to reveal the global warming trend. Correcting for data problems, compensating for volcanic episodes and deducting the indices of the major climate oscillations from the temperature record, the largest instantaneous modulations, vastly improves perception of the underlying warming signal (Thompson et al., 2009, Figure 12).
Further work on quantifying the change in climate oscillations could lead to new indices that could be applied to further smooth out the saw tooth nature of the progression of the temperature sensitivity of the climate. It remains for the climate change research community to collectively agree how the “resolved” datasets should be produced and published, showing the “smoother” baseline global warming pulse for public and policy use.
Figures

Figure 1
GISP2 Greenland Ice Sheet Project 2 Ice Core Data (Alley, 2000a; Alley, 2004; Cuffey and Clow, 1997).
Raw data points with a second order polynomial trend line added by Excel, covering data from approximately 12,000 years before present up until approximately 200 years before present to prevent the inclusion of the anomalously warm recent period. The second order polynomial trend line has been added automatically, merely to indicate the most likely point of temperature maximum but does not represent any precision in calculation.

Figure 2
GISP2 Greenland Ice Sheet Project 2 Ice Core Data (Alley, 2000a; Alley, 2004; Cuffey and Clow, 1997).
Raw data points with a second order polynomial trend line added by Excel, covering data from approximately 10,500 years before present up until approximately 200 years before present to prevent the inclusion of the anomalously warm recent period. The second order polynomial trend line has been added automatically, merely to indicate the most likely point of temperature maximum but does not represent any precision in calculation.

Figure 3
Lake Vostok Ice Core Data (Jouzel et al., 1987; Jouzel et al., 1993; Jouzel et al., 1996; Petit et al., 1999).
Raw data points with a second order polynomial trend line added by Excel, covering data from approximately 13,500 years before present up until approximately 200 years before present to prevent the inclusion of the anomalously warm recent period. The second order polynomial trend line has been added automatically, merely to indicate the most likely point of temperature maximum but does not represent any precision in calculation.

Figure 4
EPICA Community Dome C Ice Core Data (Jouzel et al., 2007).
Raw data points with a second order polynomial trend line added by Excel, covering data from approximately 13,000 years before present up until approximately 200 years before present to prevent the inclusion of the anomalously warm recent period. The second order polynomial trend line has been added automatically, merely to indicate the most likely point of temperature maximum but does not represent any precision in calculation.

Figure 5
EPICA Community Dronning Maud Land Ice Core Data (EPICA Community, 2006).
Raw data points with a second order polynomial trend line added by Excel, covering data from approximately 12,500 years before present up until approximately 200 years before present to prevent the inclusion of the anomalously warm recent period. The second order polynomial trend line has been added automatically, merely to indicate the most likely point of temperature maximum but does not represent any precision in calculation.
Abbreviations
ya = years ago, relative to 1950
BP = Before Present, relative to 1950
IPCC = Intergovernmental Panel on Climate Change
AR4 = IPCC Fourth Assessment Report
WG1 = IPCC Working Group 1
Glossary
LLGHG = Long-Lived Greenhouse Gas
ENSO = El Nino Southern Oscillation
Categories
Bob Ward Gets Stroppy

LSE’s Bob Ward has had his fill of Climate Change denial already this year, and it’s not even February yet.
I’m on some mailing list or other, to which he sent a copy of his strop directed at the poorly-equipped Global Warming Policy Foundation :-
______________________________________________________________________
Re: Global Warming Policy Foundation donor funding levels revealed…
From: Bob Ward
I am copying below the text of my e-mail, mentioned in […] Guardian article as a letter, to Benny Peiser and David Whitehouse of the Global Warming Policy Foundation. I have, as yet, not received any reply. Please feel free to pass on the e-mail message to anybody who might be interested.
Here is my message to Peiser and Whitehouse:
______________________________________________________________________
From: Bob Ward
Sent: 13 January 2011 11:13
To: ‘benny.peiser@thegwpf.org’; ‘david.whitehouse@thegwpf.org’
Subject: Inaccurate and misleading information on GWPF website
Dear Dr Peiser and Dr Whitehouse,
I am writing to draw your attention to seriously misleading and inaccurate information about global temperature trends which riddles the website of the Global Warming Policy Foundation.
Your website features a page on ‘2010 – An Unexceptional El Nino [sic] Year’, dated 3 December and apparently written by Dr Whitehouse:
https://www.thegwpf.org/the-observatory/1973-2010-an-unexceptional-el-nino-year.html
This webpage bears a number of significant errors, which I invite you to correct as soon as possible.
It states: “2010 will be remembered for just two warm months, attributable to the El Nino [sic] effect, with the rest of the year being nothing but average, or less than average temperature”. This is entirely false. Here is a link to the monthly HadCRUT3 dataset, compiled by the UK Met Office and the University of East Anglia’s Climatic Research Unit, which provides the global average temperature anomaly compared with the 1961-1990 average:
https://hadobs.metoffice.com/hadcrut3/diagnostics/global/nh+sh/
https://hadobs.metoffice.com/hadcrut3/diagnostics/global/nh+sh/monthly
This shows clearly that every month of 2010 (with the data for December not yet published) has been well above average, and indeed each month of 2010 has been one of the ten warmest on record for that month. As you know, El Niño typically recurs every two to seven years, so it cannot be responsible wholly, or even mostly, for the temperature in 2010 being amongst the highest since records began in the 19th century.
[Your] webpage also states “the UK Met Office estimates the temperature anomaly (with respect to the end of the 19th century) for 2010 so far as 0.756 deg C”. This is also inaccurate. Firstly, the Met Office’s HadCRUT3 database expresses the temperature anomaly relative to the 1961-1990 average (not the “end of the 19th century”). Secondly the anomaly for the first 10 months of the year was 0.499°C, not 0.756ºC.
[Your] webpage then purports to provide a breakdown month by month of global average temperature (presumably based on HadCRUT3). However, this breakdown appears to be based on the CRUTEM3 dataset (to which you provide a link) compiled by the University of East Anglia’s Climatic Research Unit (which you do not acknowledge):
https://www.cru.uea.ac.uk/cru/data/temperature/#datdow
https://www.cru.uea.ac.uk/cru/data/temperature/crutem3gl.txt
It seems that you are unaware that CRUTEM3 provides surface temperature land measurements only i.e. it contains no data about the 65.7% of the Earth’s surface which is covered by ocean. If you compare HadCRUT3 with CRUTEM3 you can see that the magnitude of the monthly anomalies are very different, although both still show that 2010 was an exceptionally warm year.
Your website then compounds these serious errors with another webpage, headed ‘2010: An Even More Unexceptional Year’, dated 8 December and also apparently written by Dr Whitehouse: https://www.thegwpf.org/the-observatory/2006-2010-an-even-more-unexceptional-year.html
It too contains multiple serious errors which I invite you to correct.
This page begins by providing a link to the webpage on ‘2010 – An Unexceptional El Nino [sic] Year’ and describing it as an “analysis of 2010 based on Met Office temperature data”. I do not know whether these persistently inaccurate references to your source is the result of gross sloppiness or a deliberate attempt to avoid giving credit to the University of East Anglia’s Climatic Research Unit.
This webpage purports to compare your analysis of CRUTEM3 with “other global temperature data sets that are more comprehensive”. It then claims to present an analysis “from the UK Met Office”. But your analysis does not match the HadCRUT3 data and, incredibly, this page provides a link to the CRUTEM3 dataset again. It seems that you are thoroughly confused about the differences between the datasets compiled by the Met Office and the University of East Anglia’s Climatic Research Unit.
The webpage then presents a monthly breakdown of the global temperature data compiled by the National Climatic Data Center of the National Oceanic and Atmospheric Administration. However, your analysis contains numerous errors, for instance claiming that May 2010 was cooler than May 1998 when in fact the temperature was statistically tied as the warmest on record, and claiming that June 2010 was cooler than June 1998 when it was in fact warmer and tied with June 2005 for the warmest on record.
The webpage also states that for the NCDC database “it is possible that 2010 will tie with 1998, or possible [sic] exceed it”. This is misleading as it implies that 1998 was the warmest year, when in fact 2005 was according to this record. The webpage then makes the inaccurate statement that if 2010 is warmer than 1998 “it would be due to the warm months March-June due to El Nino [sic] and not the sign of AGW”. In fact, again, as El Niño recurs on average every 2 to 7 years, it cannot be wholly or even mostly responsible for the fact that 2010 tied with 2005 as the warmest year since the NCDC record began in 1880.
The webpage also presents a monthly breakdown of the global temperature data compiled by the NASA Goddard Institute for Space Studies. However, your analysis contains numerous errors, for instance claiming that June 2010 was cooler than June 2006 when it they recorded the same temperatures, and claiming that July 2010 was cooler than May 2003 when in fact it was warmer.
You also claim that the NASA-GISS record showed that the average temperature for the 11 months to the end of November 2010 was lower than for the comparable period in 2007 and 2005. This is also completely wrong, as this period in 2010 was the warmest on record according to NASA-GISS, as this media release makes clear:
https://data.giss.nasa.gov/gistemp/2010november/
Furthermore, the home page of your website features a graph with the title ’21st Century Global Mean Temperature’. As Dr Peiser confirmed in an e-mail to me on 1 December 2009, this graph is supposed to represent the HadCRUT3 dataset. As I have pointed out on many previous occasions, your graph does not correspond to the HadCRUT3 dataset on the Met Office’s website, particularly by wrongly showing 2009 as cooler than both 2006 and 2007:
https://hadobs.metoffice.com/hadcrut3/diagnostics/global/nh+sh/
https://hadobs.metoffice.com/hadcrut3/diagnostics/global/nh+sh/annual
Despite my requests you have so far refused to correct the graph. I expect that you will update your graph when the HadCRUT3 dataset is updated with the figure for 2010. I suggest you also use that as an opportunity to correct the other mistakes in the graph.
In addition, the choice of 2001 as the starting point for your graph, as I am sure you are aware, hides the significant and unequivocal rise in global average temperature that occurred during the 20th century. As you choose to ignore the temperature record prior to 2001, visitors to your website cannot appreciate that 9 of the 10 warmest years on record have all occurred since 2000. Perhaps when you update your graph you could also make it less misleading in this respect?
Given these multiple and systematic inaccuracies in your presentation of data relating to global average temperatures, it is surprising that some journalists have been citing your information in their reports as if it was reliable. I am also surprised that the Foundation continues to claim to be an educational charity when you are disseminating such inaccurate information through your website. Or perhaps your secret sponsors are funding you to mislead the public and the media?
Yours sincerely,
Bob Ward
Policy and Communications Director
Grantham Research Institute on Climate Change and the Environment
London School of Economics and Political Science
Houghton Street
London WC2A 2AE
https://www.lse.ac.uk/grantham
______________________________________________________________________