| The El Nino Southern Oscillation is a flip-flop pattern, throwing wind and ocean currents periodically into reverse along the line of the Equator in the Pacific Ocean.
When it’s in the La Nina configuration, cold water from the ocean depths is cycled up to the surface, causing a massive plume of cooler-than-average temperatures. When the winds start looping in the other direction, a spear of warmer-than-average water spreads out across the ocean. |
| To even the most casual observer of global ocean and land temperatures, this see-saw is clearly a major influence on the data measurements – temperatures go up and down in a very regular fashion at decadal scale.
The size of the temperature swing has caused many to doubt or ignore the underlying global warming signal – but the instrumental record of temperatures is now long enough to reveal that despite the ENSO swings, temperatures as a whole are creeping upward. THE MISSING HEAT CONUNDRUM Even as the ENSO cycle makes its sinusoidal mark on Earth temperature charts, the background heating effect of increasing levels of greenhouse gases in the atmosphere continues to operate :-
NASA GISS Net Radiative Forcings The studious observer may remark that despite this positive heating effect, during La Nina episodes in ENSO, global temperatures can show a significant cold anomaly. The radiative forcings indicate that heating is going on, but the temperature record is showing cool. Where is the missing heat ? Several recent research articles have explored this very question. The answer relies on the observer taking a step back from the global average temperature record and considering what it is that happens during La Nina. The global temperatures widely reported show the warmth and chill in just a fraction of the whole Earth system – the temperatures of the upper waters of the oceans, and the land and lower atmosphere (troposphere). The La Nina ocean loop draws cool water up from very deep down in the Pacific, and so must be dumping heat at that depth as part of its cycling. This answers the question – the missing heat is being deposited far down in the ocean :- “…it seems likely that undersampling of the ocean, especially the deep ocean, may well account for the main discrepancy as it is manifested at only certain times (when La Nina is present)…” [Trenberth and Fasullo (2011)] It appeared to scientists at first that the missing heat had not been measured :-
[Trenberth and Fasullo (2011)] Kevin Trenberth is widely quoted as having written in an email : “we can’t account for the lack of warming at the moment.” However, a new research paper puts the so-called “missing energy” down to “observational uncertainties” both in the measurement of ocean temperatures, but also to assessments of the heat balance at the height above the Earth called the TOA – top of the atmosphere :- “An apparent inconsistency has been diagnosed between interannual variations in the net radiation imbalance inferred from satellite measurements and upper-ocean heating rate from in situ measurements, and this inconsistency has been interpreted as ‘missing energy’ in the system. Here we present a revised analysis of net radiation at the top of the atmosphere from satellite data, and we estimate ocean heat content, based on three independent sources. We find that the difference between the heat balance at the top of the atmosphere [TOA] and upper-ocean heat content change is not statistically significant when accounting for observational uncertainties in ocean measurements, given transitions in instrumentation and sampling…” [Loeb et al. (2012)] Progress has now been made, and the theory that La Nina is cycling heat to the lower ocean is beginning to gain ground on the basis of new evidence. THE ARGO DATA SET BEGINS Most of the ocean temperature data that we have is for the surface waters, but in 2003, the distributed array of ARGO buoys started to record data from further down. It seems from the ARGO data gathered so far, when seen in conjunction with older data gathered in other ways and corrected (Lyman et al., 2010), that global warming is affecting not just the upper 700 metres of ocean, but heating up the water at least as far down to 2000 metres :-
OCEAN HEAT UPTAKE IS ACCELERATING What’s more, the rate of change of heat content is rising – accelerating. It seems that an inflection point was reached at around 1990, where the rate of change became marked :-
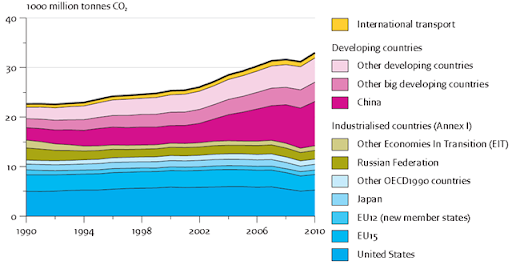
JUST WHY IS OCEAN HEAT UPTAKE ACCELERATING Well, this partly has to to with the acceleration in the emissions of greenhouse gases to the atmosphere, in particular, carbon dioxide, mostly driven by mankind’s activities :-
The biosphere and the oceans is not re-absorbing all that carbon dioxide, and those other greenhouse gases, so an increasing amount is accumulating in the atmosphere :-
The trend for greenhouse gases residing in the atmosphere is clearly accelerating – just look at the shape of the curves. This is clearly having an impact on projections for total “radiative forcing” (global warming power) in future :-
Another link EVERYTHING IS ON THE UP AND UP So, from the previous post and this one, we can see that the following things are all accelerating :- Greenhouse gas concentrations in the atmosphere So, the question is, is global warming also accelerating ? And how would we know if it is ? This will be the subject of the next enquiry… | |
Categories