| Somewhere on the Internet, as I write, somebody will be arguing about global warming – or rather, several somebodies, since disputes require multiple parties, and global warming is, as claimed by some, to be sufficiently contentious to have spawned ongoing vituperativeness. Many of the lines of reasoning will include references to the cyclic nature of Nature. Most of the data considered will be from measurements of “surface” temperatures – the temperature of the atmosphere near the land surface of the Earth, and the temperature of the oceans near the surface with the atmosphere. |
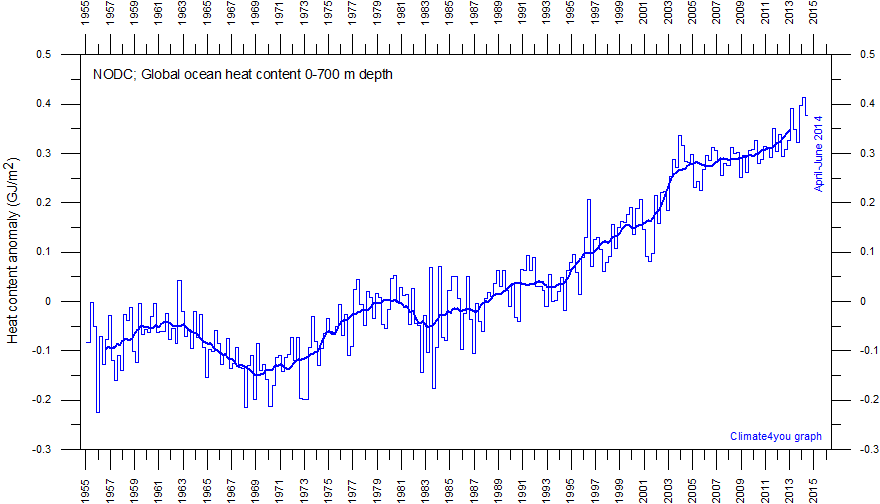
These are of course, the easiest things to measure, as this is the part of the Earth system that people inhabit, and all kinds of surface temperature records, of varying validity and accuracy, have been recorded for millenia. The lower reaches of the air and the upper waters of the oceans, are, however, prone to quite wide swings in temperatures, owing to the turbulent nature of heat, air and water transport in and around the surface of the Earth. And so, easily distracted creatures that we are, if we have any honour in our research into global warming, we consider this see-sawing surface temperature data, and we apply our best analysis techniques to try to comprehend its “walk” – the direction it is taking overall. And herein lies a faultline, that despite decades of obsession, is not easily vaulted. The use of statistical techniques to analyse surface temperature data suffers from two key problems :- (a) An assumption that we can determine accurately the period of time over which we can confidently apply statistical analysis techniques in order to be able to determine trends in surface temperatures; and (b) An assumption that surface temperatures can be treated with the usual statistical toolbox of techniques – that surface temperatures would, unless forced, fall into a distribution curve of random readings, spread like a bell curve around a central mean. And so an army of inspectors applies probabilistic statistical methods to the Earth’s surface temperature data sets, and some say it comes up with more questions than answers. For example, there may, or may not be, evidence that trends can only be claimed over decadal, or multi-decadal, periods; that all the apparent warming can be put down to natural cycles of the oceans, so a cooling phase will be next; that no trend can be claimed in 50 years because of the wild swings in the data ; that all the data is confused with volcanic episodes; that lots of mini-cycles in the Earth system are confusing us. And so on. When I find people arguing about the surface temperature records, and whether a global warming trend can be picked out from them, I ask them if they’ve looked at the bigger picture : the global heat transport system. Water can retain heat better than air – a very large proportion of the heating caused by sunlight ends up in the oceans – at different places in the depths of the oceans. Over time, this heat is exchanged with the atmosphere, rather like global Gas Central Heating, but a lot of it stays down there – so if there is a trend for global warming, it’s probably best to look in the oceans for it. And when we do, all the arguments about statistical analysis of surface atmospheric temperatures vapourise into meaninglessness, almost. The trend of ocean warming is so clear, you don’t need to apply any kind of statistical methods (apart from a couple of years of averaging) :-
Actually, the trend of atmospheric warming is also clear, if you take the long view :-
Anybody who is still arguing about the periodicity of surface temperatures, as if natural cycles could explain global warming, should think again. Surface temperature cycles are perhaps able to explain whether the next 10 years or so will see more or less global warming – but they cannot explain away the 100 year trend in global warming. And when people have come to terms that statistics cannot wipe away the reality of global warming, then comes the sting in the tail. Because the ocean is exchanging heat with the atmosphere over time, this creates a time lag – between the heat being generated in the oceans, and surface temperatures rising as a result. We ain’t seen nothing, yet. 18th January 2013 —————————————- @joabbess @richardabetts Think focus on air temps waste of time: most heat ends up in oceans https://www.climate4you.com/images/NODC%20GlobalOceanicHeatContent0-700mSince1955%20With37monthRunningAverage.gif … @lucialiljegren @nmrqip @ed_hawkins @richardabetts Number of reasons why air temps bounce around making short-term interpretation difficult @lucialiljegren @nmrqip @ed_hawkins @richardabetts …but oceans temps could well continue a solid upwards gradient over next decades @lucialiljegren @nmrqip @ed_hawkins @richardabetts If oceans continue recent warming gradient, will drag air temps on average up with them @lucialiljegren @nmrqip @ed_hawkins @richardabetts If ENSO taking new shape/profile/cycle, this could obscure some of atmospheric temp rise @lucialiljegren @nmrqip @ed_hawkins @richardabetts Even ENSO obfuscation can’t put off ~1.2degC warming next 30 years https://www.joabbess.com/2010/07/19/simple-integration/ … @lucialiljegren @nmrqip @ed_hawkins —- @ClimateOfGavin Sometimes distrust obsession re atmospheric temps: look at ocean warming @lucialiljegren @ed_hawkins @richardabetts @nmrqip @ClimateOfGavin However much @lucialiljegren obsesses on air temperatures I only care about ocean warming @ed_hawkins @richardabetts @nmrqip @ClimateOfGavin Lower atmosphere temperatures flip-flop all kinds of reasons: not oceans @lucialiljegren @ed_hawkins @richardabetts @nmrqip @ClimateOfGavin Thermal capacity of oceans means they should show more reliable trend ? @lucialiljegren @ed_hawkins @richardabetts @nmrqip ———————————————————— @ed_hawkins @joabbess @ClimateOfGavin Probably, but we only have good enough sub-surface observations of past ~50 years or so. ———————————————————— @joabbess @ed_hawkins Yet since oceans good heat retainer even mediocre records of past relevant 4 comparison eg https://www.livescience.com/19414-oceans-warming-135-years.html … @ClimateOfGavin @ed_hawkins We should definitely use what we know about thermal capacity of oceans to accept ships etc historical records @ClimateOfGavin @ed_hawkins Ocean records of last 50 years allow for calibration between surface and depths, & with historical records too @ClimateOfGavin —————————————————– @ed_hawkins @joabbess @ClimateOfGavin Of course – deep ocean observations are very relevant, but not the only type of measurement that are useful! —————————————————– @joabbess @ed_hawkins I’m sure there must be mines data going back several hundreds of years, doing same trick for mass earth temps @ClimateOfGavin —————————————————— @JohnRussell40 :- @joabbess Surely mines data will be swamped by core heat? V. hot down there. @ed_hawkins @ClimateOfGavin —————————————————— @ClimateOfGavin (Gavin Schmidt) @JohnRussell40 @joabbess @ed_hawkins borehole temperatures can in fact be deconvolved to show widespread recent warming Henry Pollack et al —————————————————— @joabbess @ClimateOfGavin I assume you mean this https://www.ncdc.noaa.gov/paleo/borehole/core.html … https://www.ncdc.noaa.gov/paleo/globalwarming/pollack.html … Think that’s pretty clear ! @JohnRussell40 @ed_hawkins @ClimateOfGavin Interestingly reflects surface up-blip in 1940s, which Phil Jones et al keep trying to smooth @JohnRussell40 @ed_hawkins — @ed_hawkins I’m trying to hint that endless debates about cyclicity/statistics of air temps = time-wasting & not productive @ClimateOfGavin @ed_hawkins If read 1 more mangled media article about statistical trends of air temperatures, going to scream & jump about @ClimateOfGavin @ed_hawkins The overall graph speaks for itself – or it should – louder than anything https://www.columbia.edu/~jeh1/mailings/2013/20130115_Temperature2012.pdf … Fig. 1 @ClimateOfGavin ——————————————— | |
Categories
Academic Freedom Be Prepared Big Picture Climate Change Climate Chaos Delay and Deny Direction of Travel Disturbing Trends Global Heating Global Warming Hide the Incline Paradigm Shapeshifter Realistic Models Science Rules Scientific Fallacy Social Chaos Sustainable Deferment The Data The Science of Communitagion The War on Error